Home > Bathroom Fixture Customer Experience Study
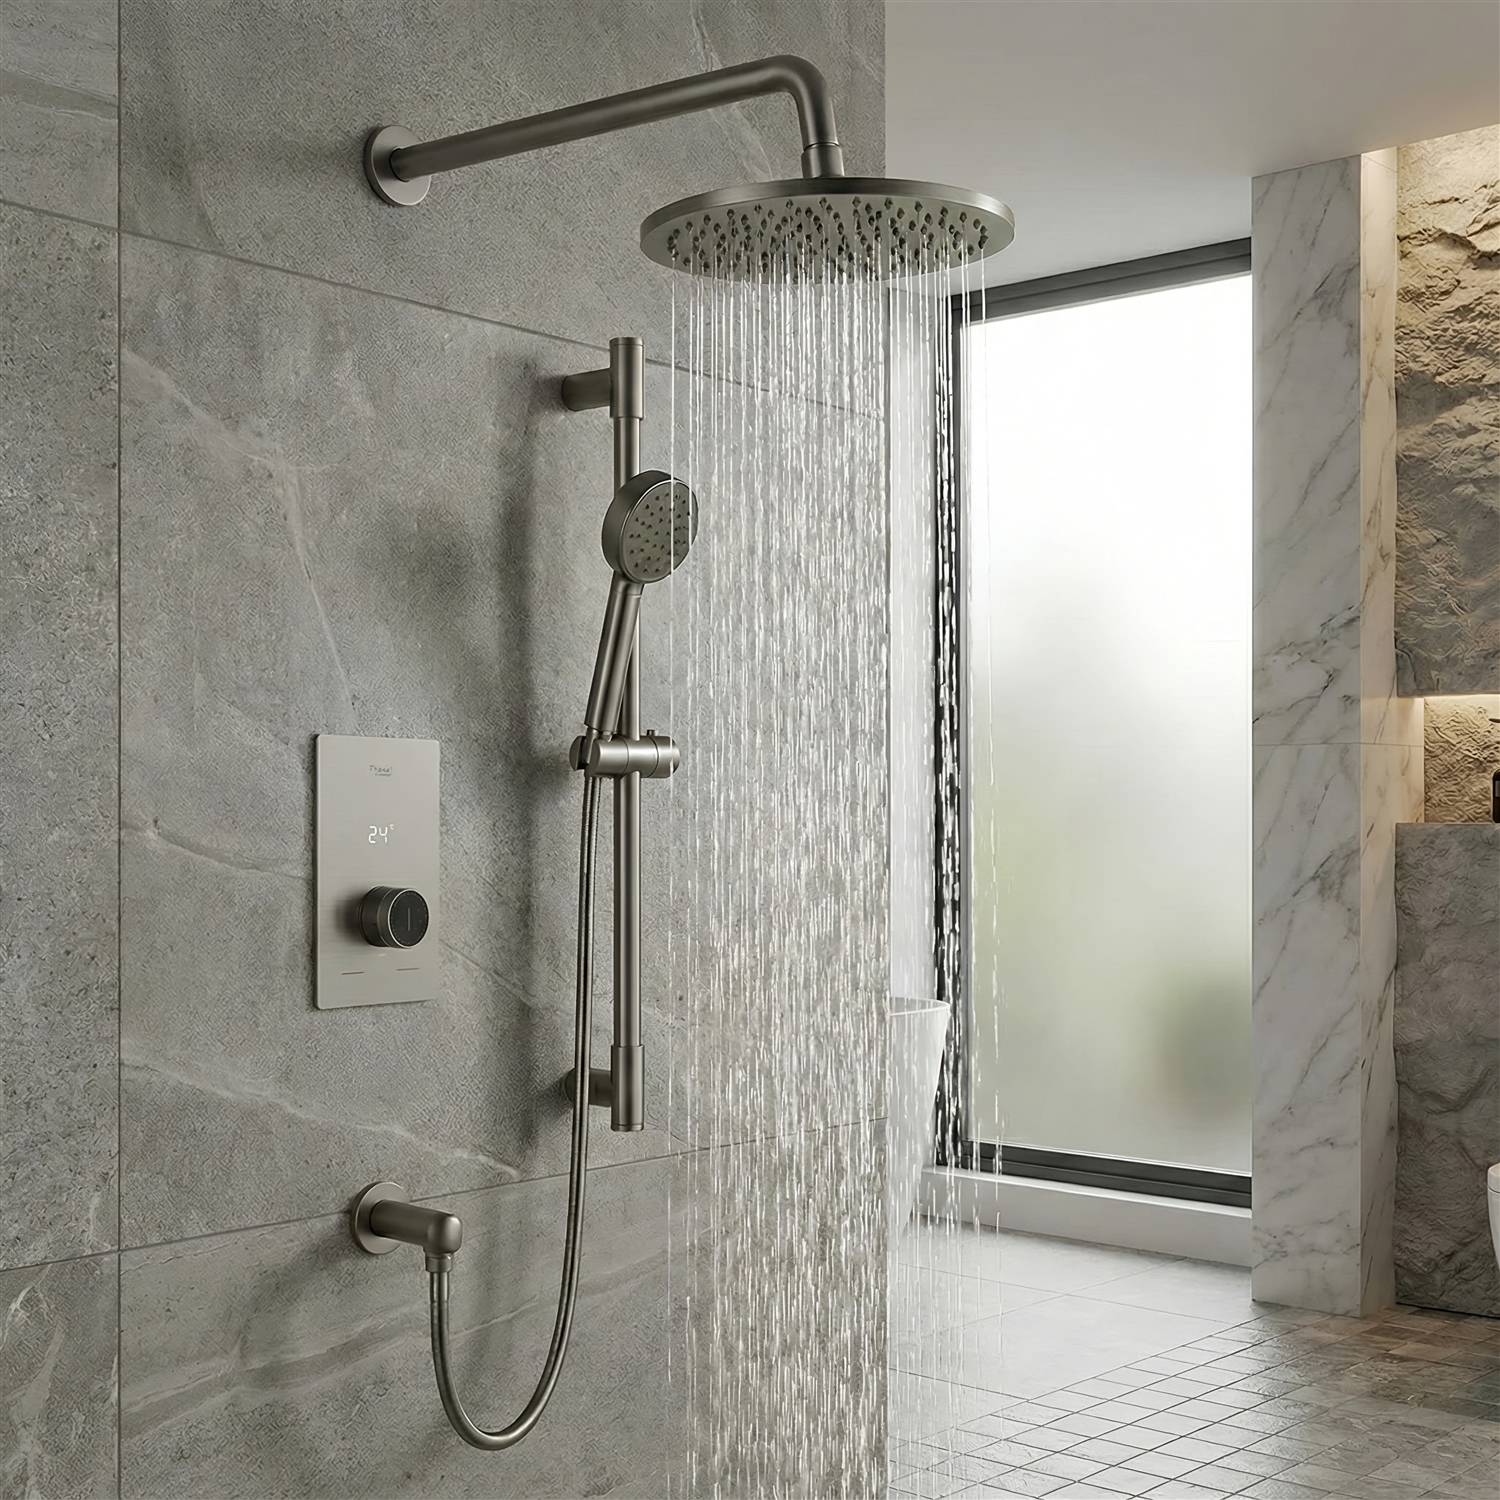
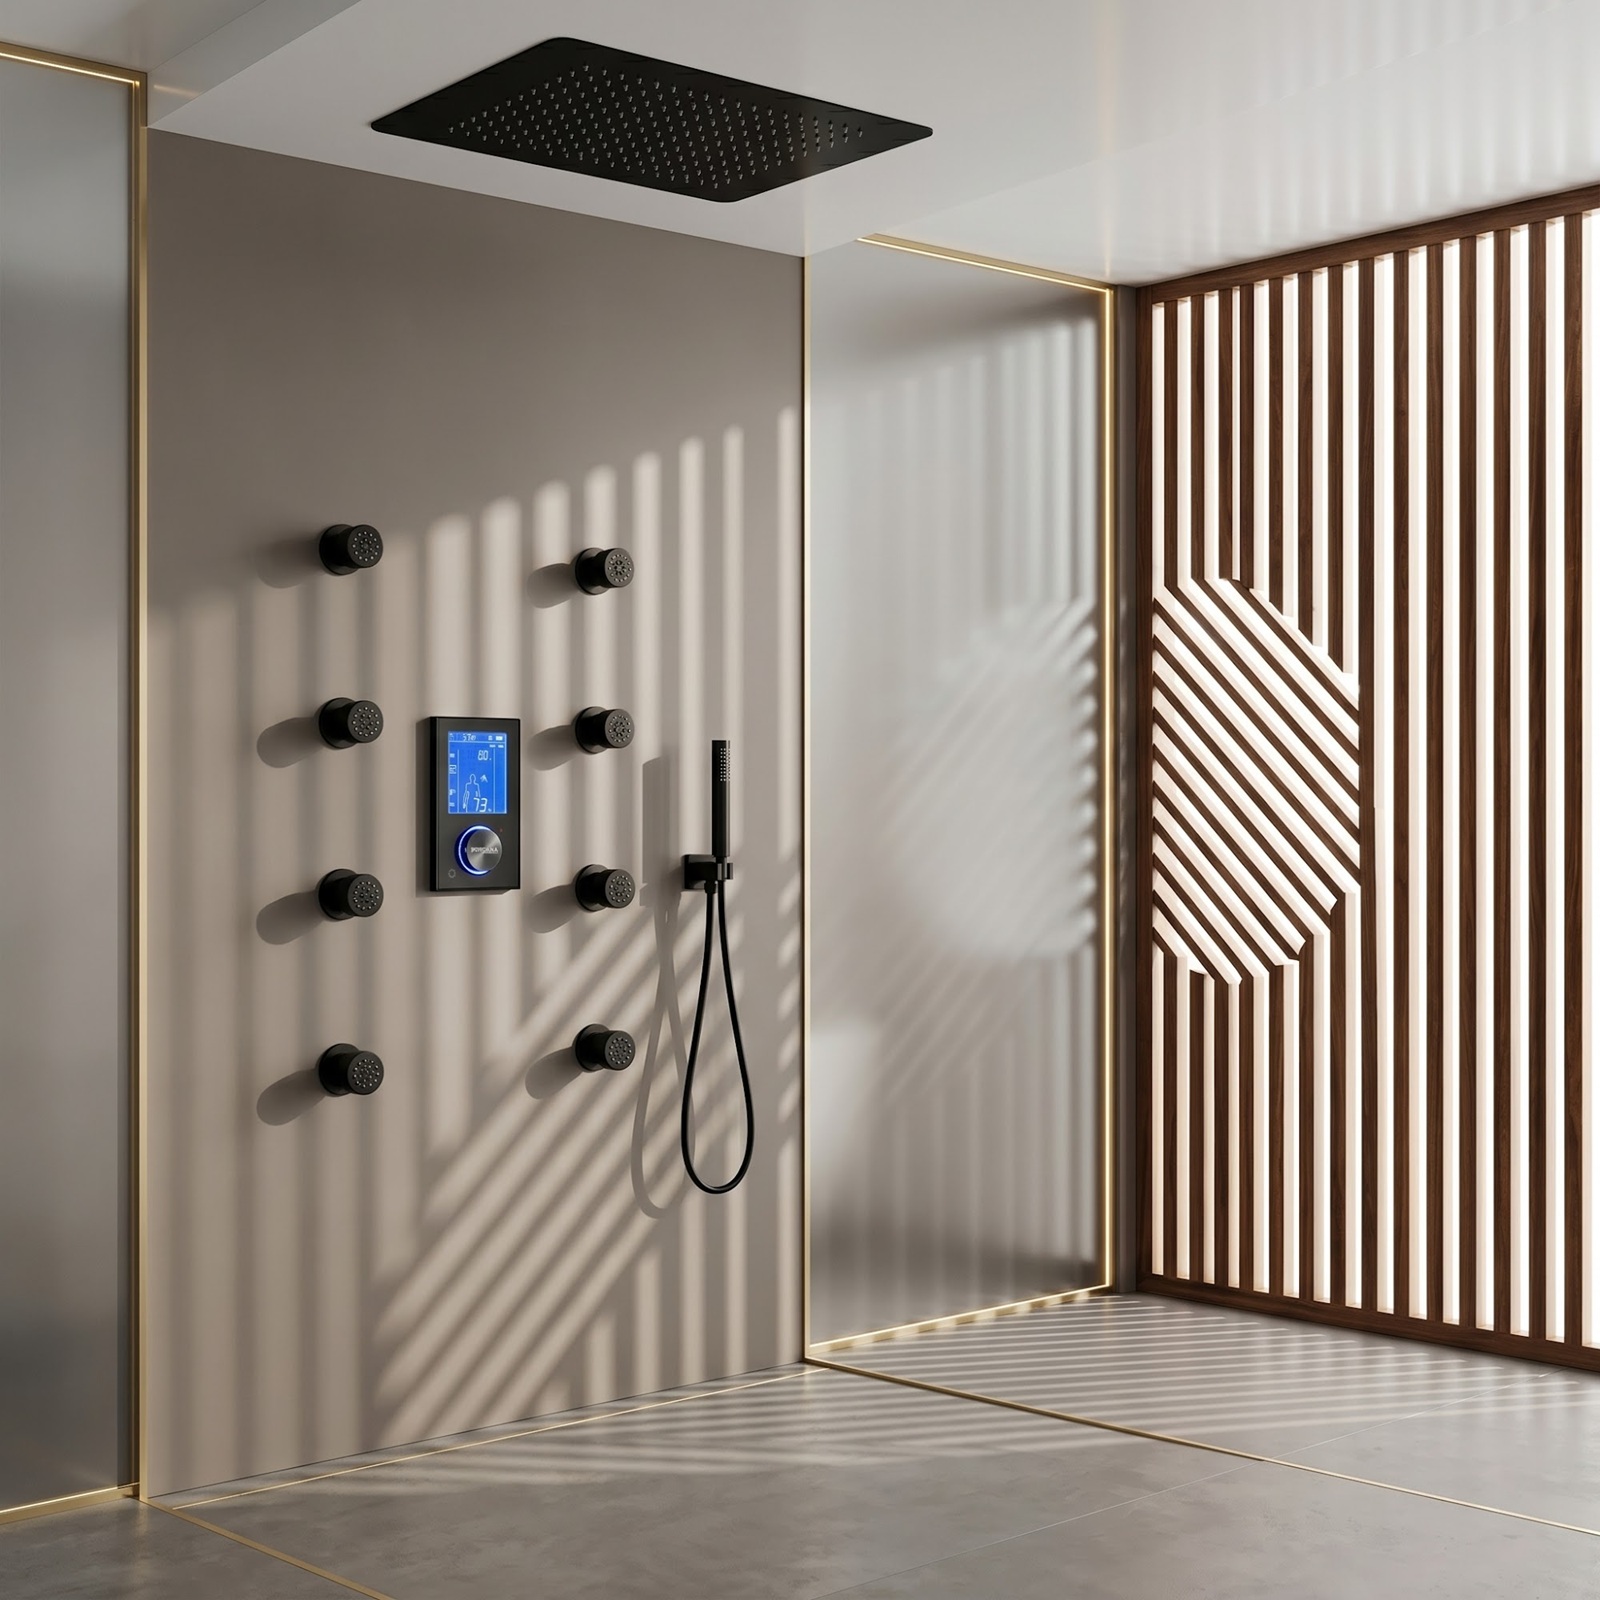
Advanced bathroom shower system representing bathroom fixture customer experience research
LONGITUDINAL MARKET-ORIENTED RESEARCH

Bathroom Fixture Customer Experience Study

A longitudinal analysis of 14,367 bathroom-fixture review records, examining customer priorities, satisfaction drivers, installation experiences, product expectations and recurring sources of dissatisfaction.

1995–2026 Records 14,367 Reviews 3,742 Product Codes

Research disclosure: This study uses anonymized proprietary customer-review records collected through BathSelect. It is designed to investigate broader bathroom-fixture customer-experience questions. The findings describe patterns within the analyzed dataset and should not be interpreted as a statistically representative measurement of every bathroom-fixture buyer, manufacturer or market channel.

EXECUTIVE SUMMARY

What customers value—and what breaks confidence

Bathroom fixtures occupy a distinctive position in the built environment. They are design objects, water-delivery devices, installed building components and frequently long-term purchases. Customers therefore judge them through several lenses at once: appearance, finish, material quality, water performance, installation requirements, reliability, delivery condition and support when something goes wrong.

The analyzed review database records overwhelmingly positive customer outcomes, with an average rating of 4.708 out of 5 and approximately 96.0% of records carrying four or five stars. However, aggregate ratings alone conceal the most useful market lesson. Satisfaction remains strongest when the product meets visual and functional expectations, while confidence falls quickly when customers encounter fulfillment problems, missing components, return friction or unresolved installation uncertainty.

The purpose of this research is not to produce another “best product” article. It is to identify recurring customer-experience patterns that can help manufacturers, designers, architects, contractors, retailers, facility teams and procurement professionals improve product selection, documentation, delivery, installation and lifecycle support.

Bathroom shower fixture used as an editorial illustration for customer experience research
DATASET AT A GLANCE

A substantial record of bathroom-fixture experience

These headline measures establish the scale of the source data while separating the complete record count from the more conservative text-analysis sample.

14,367
Review records
Complete records included in the database audit.
11,381
Screened texts
Eligible for conservative customer-language analysis.
4.708
Average rating
Overall recorded rating on a five-point scale.
96.0%
Four or five stars
High-rating share across all review records.
3,742
Product codes
Distinct product identifiers represented in the export.
Large-format bathroom fixture research divider
THE CENTRAL MARKET QUESTION

What turns an attractive fixture into a satisfactory ownership experience?

The answer extends beyond appearance. Product information, installation readiness, water performance, parts completeness, delivery condition and post-purchase support all shape the final rating.

EARLY RESEARCH FINDINGS

Six patterns shaping the study

These findings are descriptive results from the first-stage audit and topic analysis. Later sections will provide sample sizes, comparisons, statistical tests and full methodological qualifications.

01

Design drives discussion

Design and appearance language appears in approximately 56.2% of the screened review texts, making visual expectations one of the most prominent recorded customer concerns.

02

Installation shapes outcomes

Installation is not merely a contractor issue. Instructions, rough-in compatibility, component identification and access to technical information influence the customer's perception of the complete product.

03

Fulfillment is a weak point

Reviews mentioning delivery or packaging average approximately 4.551 stars, below several core product-experience topics. Missing or wrong-item language is associated with a substantially lower average rating.

04

Water performance matters

Flow, pressure, spray coverage, temperature behavior and perceived water delivery are central to fixture performance. External standards also recognize that efficiency must be evaluated alongside satisfactory performance.

05

High ratings hide friction

A 96.0% four- or five-star share confirms broadly positive recorded outcomes, but the lower-rating subset remains essential for discovering preventable failures in delivery, parts control, documentation and returns.

06

Evidence quality must vary

Not every record carries equal analytical weight. Blank text, exact duplication, standardized language and retrospective entries require separate treatment to protect the credibility of public conclusions.

Bathroom fixture illustrating the relationship between design, engineering and customer expectations
WHY THE STUDY MATTERS

Bathrooms sit inside a major and evolving improvement market

Harvard's Joint Center for Housing Studies reports that the United States remodeling market rose above $600 billion after the pandemic and remained approximately 50% above its pre-pandemic level in its 2025 assessment. The Center also identifies aging homes, aging households, property values, skilled-labor constraints, energy efficiency and accessibility as important forces shaping improvement demand.

Bathroom projects are also becoming more technically and operationally demanding. Houzz's 2025 U.S. Bathroom Trends Study, based on 1,737 homeowners, reported that 68% considered special needs in their bathroom projects, 84% hired professionals and major remodel spending increased to a national median of $22,000. These findings help explain why fixture selection now intersects with accessibility, future planning, professional installation and long-term usability.

Water performance adds another layer. EPA WaterSense states that bathrooms account for more than half of household indoor water use. WaterSense criteria also link efficiency with independently certified performance, reinforcing the principle that reduced water use cannot be evaluated separately from satisfactory flow, spray and user experience.

RESEARCH QUESTIONS

What the complete study will investigate

The study is organized around practical questions that can produce useful, citable findings rather than promotional conclusions.

01. Which fixture attributes are most frequently associated with customer satisfaction?
02. Which problems produce the sharpest reduction in customer ratings?
03. How strongly do installation and documentation affect the ownership experience?
04. How do water pressure, flow and spray expectations appear in customer feedback?
05. What role do finish, visual design and perceived material quality play?
06. Which fulfillment failures—delivery damage, missing parts or wrong items—create the greatest friction?
07. How do customer priorities differ by product category and project context?
08. Which conclusions remain stable after duplicate and standardized-language controls?
09. How have recorded expectations and complaint themes changed over time?
Closing banner for the introductory part of the bathroom fixture customer experience study
NEXT RESEARCH SECTION

Dataset methodology, quality controls and evidence grading

Part 2 will document how reviews were screened, how duplicate and standardized language was handled, why retrospective records require caution and how each public claim will receive an evidence-strength classification.

Part 1 source notes

Proprietary findings are calculated from the uploaded review database. Final publication should include a complete methodology appendix, variable definitions, review-screening rules, sample sizes and reproducible summary tables.

External context: Harvard Joint Center for Housing Studies, Improving America's Housing 2025; Houzz Research, 2025 U.S. Houzz Bathroom Trends Study; U.S. Environmental Protection Agency WaterSense bathroom, faucet and showerhead resources. External research is used for market context and does not expand the proprietary dataset's representativeness.

Part 2

Research Framework & Methodology

Every conclusion presented throughout this study is supported by documented research procedures, structured review analysis, transparent data screening, and clearly defined evidence classifications. Rather than presenting isolated statistics, this report explains how findings were produced, what limitations exist, and which conclusions are strongly supported by the available evidence.

Research Integrity Principles

The purpose of this study is to understand customer experience within the bathroom fixture market through systematic analysis of historical customer-review records rather than promotional interpretation. Every stage of the research process has been designed to maximize transparency, reproducibility, and practical usefulness for manufacturers, architects, designers, contractors, facility managers, procurement professionals, researchers, and consumers.

The research team adopted a series of integrity principles before statistical analysis began. These principles determine how evidence is evaluated, how conclusions are presented, and how limitations are disclosed.

Evidence Before Opinion

Interpretations are based on measurable observations derived from the analyzed dataset. Conclusions are not developed before examining the evidence.

Transparent Limitations

Potential weaknesses, historical imports, incomplete fields, duplicate records, and standardized review language are documented wherever they may influence interpretation.

Independent Context

External publications are used to provide industry context but never replace or expand the proprietary customer dataset.

Privacy Protection

Personally identifiable customer information is excluded from published analysis. Research findings are reported only in aggregated form.

SECTION 2.2

Study Scope

A clearly defined study scope is essential for interpreting the findings presented throughout this report. Rather than attempting to describe the entire global bathroom-fixture industry, this research examines patterns observed within a large longitudinal customer-review database spanning more than three decades of bathroom fixture purchasing, ownership, installation, and post-purchase experiences. Every conclusion presented in later sections should therefore be interpreted within the boundaries of the analyzed dataset while being considered alongside independently published industry research, housing studies, plumbing standards, sustainability guidance, and facility-management literature.

The analyzed dataset contains customer review records associated with residential and commercial bathroom fixtures, including shower systems, bathroom faucets, bathtub fillers, touchless fixtures, accessories, drains, and related plumbing products. Each review represents a customer interaction that potentially reflects multiple aspects of ownership, including visual design, installation, material quality, water performance, finish durability, packaging condition, documentation quality, shipping, customer support, and long-term product satisfaction.

Although customer reviews are inherently subjective, their collective value increases substantially when evaluated across thousands of observations. Instead of relying on isolated opinions, this study investigates recurring patterns that emerge repeatedly throughout the database. This aggregation allows meaningful examination of customer priorities, recurring friction points, and product characteristics that consistently influence overall satisfaction.
14,367
Review Records

Complete database records included within the research audit.

1995–2026
Historical Coverage

Original review dates currently represented within the dataset.

3,742
Product Codes

Distinct products represented across multiple bathroom fixture categories.

4.708★
Average Rating

Overall customer rating across the analyzed review records.

SECTION 2.3

Research Objectives

The purpose of this study extends beyond measuring customer satisfaction. Instead, the research investigates how product characteristics, ownership experiences, installation complexity, delivery performance, material expectations, and post-purchase interactions collectively influence customer perception throughout the bathroom fixture lifecycle. Each research objective was defined before detailed statistical analysis began, ensuring that conclusions were driven by observed evidence rather than selective interpretation.

Primary Research Questions

  • Which product characteristics most influence satisfaction?
  • Which issues consistently reduce customer ratings?
  • How important is installation quality?
  • Does product documentation affect customer confidence?
  • How frequently are delivery problems mentioned?
  • How significant are finish and appearance?
  • How does water performance influence ownership experience?
  • How have customer expectations evolved over time?
  • Which topics recur across multiple product categories?
  • Which findings remain strongest after quality controls?

Data Sources

The primary evidence analyzed throughout this report originates from a proprietary historical customer-review database containing 14,367 review records covering the period from 1995 through 2026. Individual records include review ratings, customer comments where available, review dates, product identifiers, and additional administrative information supporting research quality control. These proprietary records form the core analytical dataset and provide direct evidence regarding customer experience patterns observed within the analyzed population.

To place proprietary observations into broader market context, the study also references publicly documented research from recognized organizations including the Harvard Joint Center for Housing Studies, U.S. Census Bureau, Houzz Research, National Kitchen & Bath Association (NKBA), U.S. Environmental Protection Agency WaterSense Program, International Code Council (ICC), ASME, NSF, and other published technical or industry sources where appropriate. External references provide contextual information regarding housing activity, remodeling trends, plumbing standards, sustainability guidance, accessibility, and bathroom design, but they are not used to alter or replace the proprietary customer-review findings.

SECTION 2.5

Data Collection Framework

Reliable research begins with understanding how information enters a dataset. Customer reviews are not laboratory measurements; they represent voluntary descriptions of ownership experiences contributed by individual customers over an extended period. Consequently, the database contains natural variation in writing style, review length, technical detail, and descriptive terminology. Rather than attempting to remove this variability, the research process treats it as an important characteristic of authentic customer communication while applying structured quality controls to reduce analytical bias.

The reviewed records include structured variables such as review dates, product identifiers, numerical ratings, and customer comments where available. Additional administrative fields support internal quality-control procedures and historical record management. Before statistical analysis began, every field was evaluated to determine whether it represented direct customer evidence, administrative metadata, or information unsuitable for public analytical conclusions.

The objective of the collection framework is not to maximize the quantity of analyzed records but to maximize the reliability of the conclusions derived from those records.
Research Processing Pipeline

01

Import

Historical review records imported into the analytical environment.

02

Validation

Review dates, identifiers, ratings and available text evaluated for completeness.

03

Cleaning

Duplicate, blank and anomalous records screened before analysis.

04

Classification

Customer comments categorized into recurring ownership themes.

05

Analysis

Ratings, topics and historical patterns statistically summarized.

Data Cleaning & Quality Assurance

Large historical datasets inevitably contain inconsistencies that must be addressed before meaningful statistical interpretation is possible. Examples include duplicate records, incomplete entries, standardized wording, formatting inconsistencies, historical imports, and records that contain insufficient descriptive information for reliable language analysis. Rather than deleting records indiscriminately, the study applies a structured screening process designed to preserve as much legitimate evidence as possible while reducing sources of analytical distortion.

Quality Control Step Purpose Analytical Effect
Blank review detection Remove records unsuitable for text analysis Improves language accuracy
Duplicate screening Prevent repeated wording from influencing results Reduces frequency bias
Template identification Separate standardized editorial language Protects sentiment analysis
Date validation Verify historical sequence Improves trend interpretation
Field completeness Evaluate usable variables Supports reproducibility
SECTION 2.7

Duplicate & Standardized Language Detection

Customer-review datasets that span many years may include repeated descriptions, historical imports, administrative edits, or standardized language added to improve readability. If these records are analyzed without appropriate controls, repeated wording can artificially increase the apparent importance of certain themes or product characteristics. For this reason, duplicate detection formed a dedicated stage of the analytical workflow rather than a routine preprocessing task.

Where standardized editorial language was identified, records could remain appropriate for analyses involving numerical ratings, product identifiers, and historical activity, while being excluded from word-frequency calculations, quotation examples, and natural-language interpretation. Separating numerical evidence from language evidence reduces the likelihood that editorial revisions influence conclusions regarding authentic customer vocabulary or recurring ownership themes.

Research Quality Controls

Reproducibility

Every analytical stage is documented to support consistent future updates.

Transparency

Methodological limitations are disclosed alongside major findings.

Evidence Separation

Numerical analysis is distinguished from customer-language interpretation.

Continuous Review

The methodology is intended to evolve as additional verified data becomes available.

SECTION 2.8

Customer Experience Evidence Framework™

The Customer Experience Evidence Framework™ (CEEF™) is the analytical structure used to convert large volumes of customer-review records into transparent, graded, and reproducible findings. The framework does not treat every review, topic, or statistic as equally reliable. Instead, it evaluates evidence according to data quality, sample size, consistency, historical stability, cross-category confirmation, and the strength of the relationship between the observed topic and the recorded customer rating.

Customer Experience Evidence Framework research illustration

Framework Purpose

CEEF™ was developed to prevent common weaknesses in public-facing market reports, including unsupported generalization, selective use of favorable findings, unreported duplicate content, confusion between correlation and causation, and presentation of small samples as established market behavior. The framework creates a consistent path from raw customer evidence to qualified industry interpretation.

Eight-Stage Research Process

Each stage performs a distinct function. Findings cannot advance to public interpretation until the preceding quality-control steps have been completed.

01

Data Acquisition

Collect review ratings, dates, text, product identifiers, and relevant administrative fields from the available historical database.

02

Data Validation

Check rating ranges, date validity, product-code structure, missing fields, malformed records, and historical import anomalies.

03

Quality Control

Screen blank text, exact duplicates, standardized descriptions, low-information records, and entries requiring separate treatment.

04

Topic Taxonomy

Classify review language into recurring customer-experience themes such as design, installation, water performance, delivery, reliability, and support.

05

Statistical Evaluation

Measure frequency, rating distribution, topic averages, low-rating concentration, co-occurrence, time patterns, and category differences.

06

Evidence Classification

Grade each major finding according to qualifying sample size, consistency, historical coverage, and cross-category support.

07

Market Interpretation

Compare proprietary findings with documented external housing, design, plumbing, accessibility, sustainability, and facility-management research.

08

Industry Recommendations

Translate evidence into practical recommendations for manufacturers, specifiers, contractors, facility teams, procurement professionals, and customers.

SECTION 2.9

Evidence Classification Framework™

Sample size is important, but record count alone does not establish a reliable finding. A large topic may still be unstable if it appears only in a narrow time period, a single product family, or heavily standardized text. For that reason, every major conclusion is assigned an evidence grade that considers both quantity and consistency.

The grades below provide a practical publication standard. They do not claim mathematical certainty. Instead, they communicate how much analytical confidence the available customer evidence reasonably supports.

Bathroom fixture evidence classification illustration
Grade Typical Qualifying Sample Evidence Strength Required Interpretation
A 500 or more qualifying records Very Strong Consistent across multiple years, topics, or product groups and suitable for prominent reporting.
B 200–499 qualifying records Strong A recurring pattern with sufficient support for general interpretation when limitations are stated.
C 75–199 qualifying records Moderate A meaningful observation that may be limited by time, category, or contextual concentration.
D 20–74 qualifying records Limited Useful for identifying possible friction points, but not suitable for broad market generalization.
E Fewer than 20 qualifying records Exploratory Included only as an emerging signal, case pattern, or future research question.

Important: These sample thresholds are a publication convention within CEEF™. Final confidence also depends on text quality, topic precision, temporal coverage, and whether the same pattern is present across multiple product groups.

SECTION 2.10

Confidence Assessment

Confidence labels summarize the combined strength of sample size, record quality, time stability, and cross-category confirmation.

Very High

Large qualifying sample, consistent direction, broad historical coverage, multiple product groups, and low sensitivity to reasonable screening changes.

High

Strong sample and stable direction, with one or more limitations involving time period, product concentration, or variable completeness.

Moderate

Adequate evidence for cautious interpretation, but additional data or category-level confirmation would strengthen the conclusion.

Preliminary

Small, recent, narrow, or inconsistent signal that should be reported only as an observation or future research direction.

Customer review topic taxonomy illustration
SECTION 2.11

Customer Topic Taxonomy™

Customer language is highly variable. One reviewer may write “easy to fit,” another may mention “straightforward rough-in,” and another may describe “simple plumber installation.” A structured taxonomy groups related language into common analytical topics without claiming that every phrase has identical meaning.

The taxonomy is designed to reflect the complete ownership journey—from appearance and product selection through delivery, installation, daily use, maintenance, and post-purchase support.

Design & Appearance

Style, visual impact, shape, proportion, luxury perception, modern appearance, and coordination with the surrounding interior.

Finish & Color

Chrome, gold, black, nickel, bronze, color consistency, surface appearance, spotting, discoloration, and finish wear.

Material & Build

Perceived weight, brass or metal construction, component quality, rigidity, fit, finish, and overall product substance.

Installation

Rough-in compatibility, plumbing requirements, mounting, connection layout, labor complexity, instructions, and commissioning.

Water Performance

Flow, pressure, spray coverage, rainfall effect, temperature control, outlet balance, water delivery, and perceived performance.

Reliability & Use

Daily operation, leakage, valve behavior, sensor response, control consistency, durability, and continued product function.

Delivery & Packaging

Transit condition, packaging quality, delays, damage, missing components, incorrect products, and order completeness.

Support & Returns

Technical assistance, replacement parts, response quality, warranty communication, refunds, exchanges, and issue resolution.

Value & Expectations

Price, perceived value, expected quality, comparison with alternatives, recommendation intent, and satisfaction relative to cost.

Maintenance & Serviceability

Cleaning, access, cartridge or valve service, replacement parts, upkeep, mineral buildup, and long-term maintenance effort.

SECTION 2.12

Statistical Interpretation Rules

Statistical summaries describe patterns in the analyzed records. They do not automatically establish cause, market share, product superiority, or universal customer behavior.

Observed Measure What It Can Show What It Cannot Prove
Topic frequency How often a subject appears in qualifying review language. That the subject caused the customer's rating.
Average topic rating Whether reviews mentioning a topic tend to rate higher or lower. That the topic alone explains the rating difference.
Historical change How recorded review language or ratings differ across time periods. A complete market trend without controlling for product mix and review volume.
Low-rating concentration Which issue terms are unusually common in lower-rated reviews. The overall failure rate of all products sold.
Topic co-occurrence Which customer-experience subjects are frequently discussed together. That one topic caused or directly produced the other.

Frequency Is Not Importance

A rare issue may be operationally serious even when it appears in relatively few reviews.

Positive Reviews Still Matter

High-rated reviews reveal the attributes customers notice when a fixture meets or exceeds expectations.

Negative Reviews Are Diagnostic

Lower-rated reviews often contain richer information about preventable friction, missing information, and process failures.

SECTION 2.13

Evidence Badge™

Major findings throughout the report should carry an Evidence Badge™. The badge gives readers an immediate summary of the analytical support behind a claim instead of requiring them to locate every methodological detail before interpreting a chart or statistic.

EVIDENCE STRENGTH: VERY HIGH

Example Badge Format

1,240 qualifying reviews · multiple product categories · long-term consistency · stable after duplicate and standardized-language screening.

Evidence badge research visualization
SECTION 2.14

Reproducibility & Future Editions

The framework is intended to support repeated annual or periodic analysis without changing the rules simply because new results are more or less favorable.

Stable Definitions

Core topic definitions should remain consistent so future results can be compared with earlier editions.

Documented Revisions

Any changes to screening, classification, thresholds, or evidence grades should be disclosed in the methodology notes.

Historical Comparability

Trend comparisons should use consistent time periods and report major shifts in product mix or review volume.

Repeatable Outputs

Summary tables, category definitions, and exclusion counts should be retained for audit and future updates.

Transition to bathroom fixture market analysis
NEXT: PART 3

Bathroom Market Context

With the analytical framework established, the report can now examine how housing age, remodeling activity, professional installation, accessibility, water efficiency, hospitality requirements, smart technology, and long-term maintenance provide context for the customer experiences observed in the dataset.

PART 3 · MARKET CONTEXT

The Market Forces Reshaping Bathroom Decisions

Customer reviews do not exist in isolation. Bathroom-fixture expectations are shaped by the age and condition of buildings, remodeling investment, professional labor, accessibility planning, water-efficiency requirements, wellness priorities, project complexity, and the increasing integration of technology into everyday fixtures. This section documents the external market conditions that help explain why customers discuss design, installation, water performance, reliability, delivery, and long-term usability so frequently.

Bathroom fixture market context and customer expectations
MARKET CONTEXT PRINCIPLE

A bathroom fixture is evaluated as a product, an installed component, and part of a larger living environment.

The final customer experience depends not only on the fixture itself, but also on project planning, compatibility, labor quality, water conditions, delivery accuracy, documentation, maintenance access, and how well the product supports the intended use of the space.

SECTION 3.1

Remodeling Remains a Major Economic Force

The bathroom-fixture market is closely connected to the broader repair and remodeling economy. Harvard University's Joint Center for Housing Studies reported in 2025 that the United States remodeling market had risen above $600 billion after the pandemic and remained approximately 50% above its pre-pandemic level despite some softening. The Center identified aging homes, aging households, elevated property values, inflation, industry fragmentation, skilled-labor shortages, accessibility needs, energy efficiency, and resilience as major forces affecting the improvement market.

These conditions are directly relevant to bathroom fixtures. Older homes may require nonstandard rough-ins, plumbing upgrades, pressure evaluation, wall access, drain relocation, valve replacement, or adaptation to current codes and product dimensions. As product sophistication increases, installation readiness becomes a larger part of the ownership experience.

The review data should therefore be interpreted within a market where customers are often combining new fixtures with existing building conditions. A product may be technically sound while still producing frustration if the project team has incomplete dimensional information, inaccurate compatibility assumptions, or insufficient installation planning.

Housing Report
Bathroom remodeling market research illustration
$600B+

Remodeling Market

Harvard JCHS reported that U.S. remodeling activity rose above this level after the pandemic.

50%

Above Pre-Pandemic

The 2025 assessment described the market as remaining approximately 50% above its earlier level.

145M

U.S. Homes

Harvard JCHS highlighted the scale of the housing stock requiring preservation, modernization, and resilience investment.

Complex

Installation Conditions

Aging plumbing and diverse existing conditions increase the importance of documentation and compatibility.

Professional bathroom renovation and installation context
SECTION 3.2

Bathrooms Are High-Involvement Projects

Houzz's 2025 U.S. Bathroom Trends Study surveyed 1,737 U.S. homeowners who had recently completed, were planning, or were actively undertaking bathroom renovation projects. The study reported that 84% hired professionals, demonstrating that bathroom renovation is commonly a coordinated construction activity rather than a simple retail purchase.

The same research reported a national median spend of $22,000 for major bathroom remodels, while larger bathrooms of at least 100 square feet held a median spend of $25,000. Separately, Houzz's broader 2025 renovation research reported that median spending on major remodels of small primary bathrooms rose 13% to $17,000.

Higher project investment raises expectations for accuracy. Customers are more likely to scrutinize finish coordination, product dimensions, control functionality, component completeness, installation documentation, and the ability to resolve problems without delaying the broader construction schedule.

What Professional Involvement Changes

Specification Accuracy

Dimensions, flow requirements, rough-ins, valve locations, and compatible components must be available before installation begins.

Trade Coordination

Plumbers, tile installers, electricians, designers, general contractors, and owners may all depend on the same product information.

Schedule Sensitivity

A missing valve, incorrect finish, or damaged component can interrupt multiple trades and delay completion.

Lifecycle Expectations

Larger investments increase demand for durability, replacement parts, maintenance guidance, and continued serviceability.

SECTION 3.3

Accessibility Is Moving Into Mainstream Planning

Accessibility is no longer limited to specialized institutional projects. Houzz reported that 68% of homeowners in its 2025 bathroom study considered special needs in their projects. Nearly half expected those needs to emerge five or more years in the future, indicating that many renovations are being designed for adaptability and continued use rather than only immediate requirements.

The study also reported increased attention to aging household members, nonslip surfaces, grab bars, seating, and layouts that improve access. Wet rooms accounted for one in six renovated bathrooms, with respondents citing space use, appearance, and accessibility among the reasons for selecting the format.

For fixture evaluation, this expands the definition of performance. Handle operation, control visibility, temperature management, reach, shower entry, hand-shower flexibility, seating coordination, and safe movement can be just as important as style or maximum spray coverage.

Accessibility Data
Future-ready accessible bathroom fixture planning
68%

Consider Special Needs

Share reported in the 2025 Houzz bathroom-renovation study.

47%

Planning Ahead

Expected special needs to arise five or more years in the future.

16%

Wet Rooms

One in six renovated bathrooms used a wet-room configuration.

Long-Term

Use Planning

Bathroom decisions increasingly consider adaptability and aging in place.

SECTION 3.4

Water Efficiency Must Coexist With Satisfactory Performance

Water conservation is a central bathroom-market issue, but the customer experience depends on whether reduced consumption still produces acceptable flow, spray coverage, rinsing, temperature behavior, and daily usability.

Water-efficient bathroom fixture performance research
50%+

Indoor Household Water

EPA WaterSense identifies bathrooms as the largest source of household indoor water use, accounting for more than half of the total.

17%

Indoor Use From Showering

EPA reports that showering represents nearly 17% of residential indoor water use and almost 40 gallons per day for an average family.

2.0 GPM

Labeled Showerhead Maximum

WaterSense-labeled showerheads must use no more than 2.0 gallons per minute and demonstrate satisfactory performance.

30%+

Faucet Flow Reduction

WaterSense-labeled private-lavatory faucets can reduce flow by 30% or more from the 2.2 GPM standard while maintaining ample flow.

Implication for Customer Reviews

Customer references to pressure, flow, rainfall effect, spray distribution, rinsing, and outlet balance should not be interpreted as a demand for unrestricted water consumption. They often reflect the practical challenge of achieving an acceptable experience within efficiency limits, plumbing conditions, and multi-outlet system design.

SECTION 3.5

The Bathroom Is Becoming a Wellness and Technology Space

Houzz's 2025 research reported that one quarter of surveyed homeowners used the primary bathroom for rest and relaxation, while 24% used it for beauty and pampering routines. More than one-third of renovated bathrooms incorporated wellness-oriented features, including upgraded lighting, soaking or spa tubs, and water features.

This shift helps explain growing interest in multi-function shower systems, rainfall outlets, hand showers, body sprays, digital controls, temperature presets, lighting, and coordinated design. These products expand the customer's experience but also create new requirements involving water supply, drainage, electrical planning, waterproofing, control logic, commissioning, and maintenance access.

As the fixture becomes more sophisticated, customer satisfaction depends increasingly on the entire system. A visually impressive product may still disappoint if installation information is incomplete, water supply is insufficient, controls are unintuitive, or future service requires disruptive access.

Smart bathroom wellness and technology market trend

Product Sophistication Expands the Experience Chain

Customer Expectation Technical Dependency Possible Friction
Multiple simultaneous outlets Supply pressure, flow capacity, valve sizing, pipe diameter Weak output or unexpected performance when several outlets operate
Digital or smart control Power, wiring, control compatibility, commissioning Installation delays, setup confusion, inaccessible service components
Large-format rainfall coverage Ceiling support, drainage, pressure, flow distribution Uneven spray, overspray, drainage limitations, ceiling coordination
Thermostatic stability Hot-water supply, valve calibration, pressure balance Temperature variation, slow response, incorrect commissioning
Coordinated luxury finish Batch consistency, cleaning guidance, installation protection Finish mismatch, scratching, spotting, or damage during construction
Bathroom market context summary and transition to customer priorities
MARKET CONTEXT SUMMARY

Customer expectations are rising because the bathroom itself is doing more.

Bathrooms are being remodeled at meaningful cost, installed by coordinated professional teams, planned for future accessibility, evaluated for water efficiency, and increasingly designed around wellness and technology. These conditions help explain why customers judge fixtures across a much broader range of criteria than appearance alone.

The next part returns to the proprietary dataset to identify which of these expectations appear most frequently in customer language and which topics are most strongly associated with high or low ratings.

Part 3A Source Notes

Harvard Joint Center for Housing Studies, Improving America's Housing 2025: https://www.jchs.harvard.edu/improving-americas-housing-2025

Houzz Research, 2025 U.S. Houzz Bathroom Trends Study: https://www.houzz.com/magazine/2025-u-s-houzz-bathroom-trends-study-stsetivw-vs~183227801

Houzz Research, 2025 U.S. Houzz & Home Renovation Trends: https://www.houzz.com/magazine/2025-u-s-houzz-and-home-renovation-trends-stsetivw-vs~181188659

U.S. Environmental Protection Agency WaterSense, Your Better Bathroom: https://www.epa.gov/watersense/your-better-bathroom

U.S. Environmental Protection Agency WaterSense, Showerheads: https://www.epa.gov/watersense/showerheads

U.S. Environmental Protection Agency WaterSense, Bathroom Faucets: https://www.epa.gov/watersense/bathroom-faucets

PART 4 · PROPRIETARY CUSTOMER EVIDENCE

Customer Priorities & Satisfaction Drivers

This section returns to the screened customer-review dataset to identify the subjects customers discuss most often and the topics associated with stronger or weaker ratings. The analysis uses 11,381 review texts that passed the initial eligibility controls described in the methodology.

Customer priorities and satisfaction drivers in bathroom fixture reviews
PRIMARY FINDING

Customers reward a complete experience—not appearance alone.

Design creates initial enthusiasm, but satisfaction also depends on material quality, finish execution, installation readiness, water performance, delivery accuracy, and the ability to resolve problems efficiently.

11,381

Eligible Reviews

Screened review texts used for customer-language topic analysis.

4.703

Screened Average

Average rating within the eligible customer-language sample.

96.3%

Four or Five Stars

High-rating share within the screened text-analysis sample.

3.7%

Three Stars or Lower

Smaller but diagnostically important lower-rating subset.

Interpretation rule: Topic averages describe reviews that mention a subject. They do not prove that the subject alone caused the recorded rating.

SECTION 4.1

Design Leads the Customer Conversation

Design and appearance language appears in 6,391 eligible review texts, representing 56.2% of the screened sample. This is the most frequently identified customer-experience topic, confirming that bathroom fixtures are judged as visible architectural and interior-design elements rather than purely functional plumbing components.

Installation is the second-most common topic, appearing in 5,376 reviews, followed by reliability and daily use in 5,098 reviews, build and materials in 4,973, and finish and color in 4,885. Together, these subjects describe the core customer journey: selecting a product for its appearance, evaluating its physical quality, installing it correctly, and judging how reliably it performs over time.

The frequency ranking also shows why product pages cannot rely on decorative imagery alone. Customers require enough technical and installation information to convert visual preference into a successful completed project.

Bathroom fixture design as the leading customer review topic
Customer Topic Qualifying Reviews Share of Sample CEEF™ Grade
Design & Appearance 6,391 56.2% A
Installation 5,376 47.2% A
Reliability & Use 5,098 44.8% A
Build & Materials 4,973 43.7% A
Finish & Color 4,885 42.9% A
Value & Price 3,273 28.8% A
Delivery & Packaging 3,182 28.0% A
Customer Support 2,677 23.5% A
Water Performance 2,644 23.2% A
SECTION 4.2

The Strongest Positive Associations

Reviews mentioning design, finish, and material quality carry higher average ratings than reviews that do not mention those topics. The differences are not proof of causation, but their direction and large sample sizes make them important indicators of what customers notice when a fixture meets expectations.

Positive bathroom fixture satisfaction drivers
4.739

Design & Appearance

Highest average among the major recurring topics and 0.084 stars above reviews without identified design language.

EVIDENCE: A · VERY STRONG
4.729

Finish & Color

Reviews mentioning finish or color average 0.046 stars above reviews without identified finish language.

EVIDENCE: A · VERY STRONG
4.726

Build & Materials

Material and construction language is associated with an average 0.041 stars above reviews without the topic.

EVIDENCE: A · VERY STRONG
Complete bathroom fixture customer experience model
SECTION 4.3

Satisfaction Is Built Across Five Connected Stages

The topic pattern supports a complete-experience model. Customers first evaluate whether the fixture fits the intended design. They then judge physical construction and finish quality, determine whether installation is understandable and compatible, evaluate water and control performance, and finally assess reliability and support during continued ownership.

Weakness at any stage can affect the final rating. A strong-looking product may be undermined by incomplete instructions. Excellent water performance may be overshadowed by a missing component. Responsive support may recover a problem, but it cannot always remove schedule disruption or installation cost.

1. Design
2. Build
3. Install
4. Perform
5. Support
SECTION 4.4

Customer Priority & Rating Matrix

Frequency shows how commonly a topic appears. Rating association shows whether reviews mentioning the topic tend to sit above or below the rest of the screened sample.

Topic Reviews Average Rating Difference vs. Non-Mention Interpretation
Design & Appearance 6,391 4.739 +0.084 Frequent and positively associated
Finish & Color 4,885 4.729 +0.046 Frequent and positively associated
Build & Materials 4,973 4.726 +0.041 Frequent and positively associated
Installation 5,376 4.714 +0.022 Highly frequent; mixed positive and friction language
Value & Price 3,273 4.711 +0.012 Broadly neutral to mildly positive
Water Performance 2,644 4.683 −0.025 Important performance topic with varied expectations
Delivery & Packaging 3,182 4.551 −0.211 Frequent and clearly associated with lower ratings
SECTION 4.5

Delivery Can Override Product Satisfaction

Delivery and packaging is the clearest negative association among the high-frequency topics. The 3,182 eligible reviews mentioning this subject average 4.551 stars, approximately 0.211 stars below reviews without identified delivery or packaging language.

Six percent of delivery-related reviews carry three stars or lower, compared with 3.7% across the complete screened sample. This does not mean every delivery mention is negative; many customers praise secure packaging or timely arrival. The lower average indicates that fulfillment problems have enough severity to materially alter the topic's overall rating profile.

For complex fixture systems, fulfillment accuracy is part of product performance. Missing valves, incorrect finishes, damaged components, or incomplete hardware can interrupt installation and impose costs that extend beyond the replacement value of the affected part.

EVIDENCE BADGE™ · GRADE A

3,182 qualifying reviews · 28.0% of screened sample · strong negative rating association · high operational relevance.

Delivery and packaging influence on bathroom fixture satisfaction
SECTION 4.6

What the Priority Data Means

For Manufacturers

Product development should connect visual design with material specification, finish consistency, hydraulic performance, installation clarity, and service access.

For Retailers

Product pages should reduce uncertainty with complete dimensions, rough-in requirements, included-component lists, finish guidance, and realistic delivery information.

For Designers

Aesthetic selection should be coordinated with installation feasibility, supply capacity, drainage, maintenance access, and finish-care requirements.

For Contractors

Pre-installation inspection and component verification can prevent schedule disruption from missing, incorrect, or damaged items.

Transition to customer friction and lower-rating analysis
NEXT: PART 4B

Customer Friction, Complaints & Lower-Rating Signals

The next section examines the smaller but highly informative group of reviews involving returns, refunds, missing items, incorrect products, delivery failures, installation uncertainty, and unresolved performance expectations.

Part 4A Methodology Note

Results are based on 11,381 review texts classified as eligible for the initial customer-language analysis. Topic identification uses documented keyword and phrase rules applied consistently across the screened dataset.

Topic overlap is permitted because a single review may discuss design, installation, water performance, delivery, and support. Differences in average rating are descriptive associations and should not be interpreted as proof that a single topic caused the recorded rating.

PART 4B · LOWER-RATING ANALYSIS

Customer Friction, Complaints & Recovery Risk

Lower-rated reviews form a relatively small share of the screened dataset, but they contain some of the most actionable evidence in the study. These records reveal where product selection, fulfillment, installation, documentation, performance expectations, and post-purchase support are most likely to fail.

Customer friction and complaint analysis for bathroom fixtures
PRIMARY FRICTION FINDING

The most damaging problems are often operational, not aesthetic.

Missing components, incorrect items, returns, refunds, and delivery failures produce much larger rating declines than most ordinary product-performance topics.

419

Three Stars or Lower

Lower-rated records within the screened customer-language sample.

3.7%

Lower-Rating Share

The diagnostic subset is small relative to the complete screened sample.

4.703

Screened Average

Reference point for interpreting topic-specific rating declines.

Diagnostic

Research Value

Lower-rated reviews often reveal preventable process and product failures.

Research principle: A low-frequency issue can still be strategically important when it causes severe rating decline, installation delay, added labor, or loss of customer confidence.

SECTION 4.7

Missing or Incorrect Items Create the Sharpest Decline

Seventy-four eligible reviews contain language indicating a missing component, wrong item, incorrect part, or incomplete order. Their average rating is 3.554 stars—approximately 1.156 stars below reviews without this signal.

More than 43% of these reviews carry three stars or lower, compared with approximately 3.7% across the complete screened sample. This makes missing or incorrect items one of the clearest high-severity friction signals in the database.

The operational effect can exceed the immediate product issue. A missing valve, mounting component, connector, control, or finish-matched part may stop installation, require a second trade visit, delay tile closure, or interrupt a broader construction schedule.

EVIDENCE BADGE™ · GRADE C

74 qualifying reviews · moderate sample · exceptionally large rating decline · high operational severity.

Missing and incorrect bathroom fixture component complaint analysis
Friction Signal Reviews Average Rating Three Stars or Lower Severity Interpretation
Missing / Wrong Item 74 3.554 43.2% Highest measured severity; direct installation and schedule risk
Return / Refund 259 4.039 26.6% Strong dissatisfaction signal and possible recovery failure
Delivery / Packaging 3,182 4.551 6.0% Broad, high-frequency fulfillment risk
Customer Support 2,677 4.696 4.1% Mixed signal: support can reflect either praise or problem recovery
Water Performance 2,644 4.683 2.3% Important expectation topic, but not inherently a complaint signal
Return and refund friction in bathroom fixture customer experience
SECTION 4.8

Returns Often Indicate a Failure Earlier in the Journey

Return or refund language appears in 259 eligible review texts. These reviews average 4.039 stars, approximately 0.680 stars below reviews without return or refund language. More than one quarter carry three stars or lower.

A return is usually the final visible event in a longer sequence. The underlying cause may involve incorrect selection, finish mismatch, dimensional incompatibility, incomplete product information, shipping damage, wrong components, delayed delivery, or performance that differed from customer expectations.

Effective return analysis should therefore move beyond the return itself. Manufacturers and retailers need structured reason codes that identify whether the initiating failure occurred during product presentation, order preparation, fulfillment, installation, product use, or service recovery.

EVIDENCE BADGE™ · GRADE B

259 qualifying reviews · strong negative association · 26.6% lower-rating concentration.

SECTION 4.9

Delivery Is the Largest High-Frequency Friction Category

Delivery and packaging language appears in 3,182 eligible reviews, or 28.0% of the screened sample. Because this topic contains both positive and negative comments, its 4.551-star average is especially important: negative fulfillment experiences are severe enough to pull down a large and otherwise mixed topic group.

Bathroom fixture delivery and packaging risk

Transit Damage

Heavy, polished, glass, electronic, or multi-component fixtures require packaging designed around weight, surface protection, and internal movement.

Order Completeness

Complex systems should be verified against a component checklist before shipment, particularly when multiple boxes are involved.

Finish Protection

Premium finishes require separation from metal hardware, abrasion protection, and clear handling instructions during construction.

Delivery Visibility

Accurate lead times, shipment status, box counts, and exception communication can reduce uncertainty before installation.

SECTION 4.10

Installation Is Common, but Not Automatically Negative

Installation language appears in 5,376 eligible reviews—47.2% of the screened sample—yet the topic's average rating is 4.714, slightly above reviews without installation language. This indicates that customers discuss installation in both successful and unsuccessful contexts.

The analytical lesson is important: installation itself is not the problem. Friction emerges when product dimensions, rough-ins, included components, connection types, wall access, water supply, electrical requirements, or commissioning procedures are unclear or incompatible.

Strong installation documentation can become a satisfaction driver because it allows the customer and contractor to complete a complex project with fewer surprises. Weak documentation converts otherwise manageable complexity into uncertainty, additional labor, and schedule risk.

Bathroom fixture installation complexity and documentation

Installation Friction Control Matrix

Risk Area Customer or Trade Concern Preventive Documentation
Rough-In Wall depth, valve location, outlet spacing, ceiling support Dimensioned rough-in drawing and tolerances
Water Supply Pressure, flow, pipe size, multi-outlet operation Minimum pressure, expected flow, supply recommendations
Included Parts Missing fittings, valves, brackets, hoses, transformers Complete illustrated component list
Electrical Power location, transformer, access, wet-area coordination Wiring diagram and service-access requirements
Commissioning Calibration, temperature setup, control pairing, flushing Step-by-step startup and verification checklist
Bathroom fixture water performance expectations and complaint analysis
SECTION 4.11

Water Performance Complaints Often Begin With Expectation Gaps

Water-performance language appears in 2,644 eligible reviews and carries an average rating of 4.683. The topic is only modestly below the screened average, and just 2.3% of these reviews carry three stars or lower.

This suggests that water performance is primarily an expectation-management and system-design issue rather than a broad failure category. Customers may describe pressure, flow, spray coverage, rainfall effect, outlet balance, or temperature behavior without expressing dissatisfaction.

Complaints become more likely when marketing language implies pressure enhancement without documenting plumbing requirements, when multiple outlets exceed available supply, or when large spray surfaces are evaluated without considering flow distribution and household pressure.

SECTION 4.12

Customer Recovery Should Match the Type of Failure

A generic apology is not an adequate response when the customer faces trade delays, added labor, damaged finishes, or an unusable bathroom. Recovery should address both the product issue and the practical consequence.

01

Diagnose Quickly

Identify whether the issue involves selection, shipping, missing components, installation, product performance, or service communication.

02

Protect the Schedule

Prioritize replacement parts and technical answers when contractors or active construction phases are waiting.

03

Resolve Completely

Confirm that the replacement, refund, technical correction, or installation solution actually closes the original problem.

04

Prevent Recurrence

Feed complaint causes back into packaging, product content, component checks, documentation, and training.

Transition to historical bathroom fixture customer trends
NEXT: PART 5

Historical Trends & Changing Customer Expectations

The next section examines how review volume, ratings, and customer-language themes changed across time, while separating reliable high-volume periods from early years with limited or retrospectively entered records.

Part 4B Methodology Note

Complaint signals are derived from documented keyword and phrase classifications within the 11,381-review eligible text sample. A review may contain more than one signal.

The analysis measures association with recorded ratings. It does not establish product failure rates, return rates, shipping-loss rates, or causal responsibility. The database does not contain complete sales-denominator or independently verified incident-resolution data.

PART 5 · HISTORICAL TRENDS

Thirty Years of Bathroom Fixture Evolution

Between the mid-1990s and 2026, bathroom fixtures evolved from primarily functional plumbing products into increasingly coordinated systems shaped by architecture, water efficiency, accessibility, wellness, digital controls, installation planning, and lifecycle service. The review database spans this transition, although the earliest years contain limited and partly retrospective records and must be interpreted cautiously.

Thirty years of bathroom fixture evolution
1995–2026

From individual fixtures to integrated bathroom experiences

Design, efficiency, human wellbeing, smart operation, professional coordination, and long-term serviceability increasingly converge in a single customer decision.

Historical Interpretation Boundary

The database contains original review-date values from 1995 through 2026. However, the earliest period has very small sample sizes, and 12 records newly added in the updated export were retrospectively dated between 1995 and 1998. Accordingly, this section uses early records as historical context rather than as proof of precise annual market behavior. Stronger year-by-year conclusions will begin in later, higher-volume periods.

SECTION 5.1.1

The Definition of a “Good Fixture” Expanded

In the earlier market, fixture evaluation was commonly centered on recognizable product attributes: appearance, finish, price, basic operation, and whether the item arrived in usable condition. These factors remain important, but they now sit inside a much larger decision framework.

Contemporary bathroom projects may require coordination among plumbing, electrical, waterproofing, structural support, tile, controls, drainage, accessibility, and interior-design requirements. Large showerheads, multiple outlets, thermostatic valves, touchless activation, integrated lighting, digital interfaces, and concealed components can create a richer experience while also increasing planning and commissioning demands.

As a result, the modern customer no longer evaluates only the visible fixture. The experience includes product information, compatibility, delivery accuracy, installation support, water performance, control behavior, maintenance access, replacement parts, and service recovery.

Modern integrated bathroom fixture system
01

Design Integration

Fixtures increasingly function as coordinated architectural elements rather than isolated plumbing components.

02

Measured Efficiency

Water consumption became more visible to buyers, regulators, building programs, and product-certification systems.

03

Human-Centered Design

Accessibility, aging in place, wellness, safety, and intuitive operation became more central to bathroom planning.

04

System Complexity

Multi-function and digital systems expanded both customer possibilities and installation dependencies.

SECTION 5.1.2

Milestones That Changed the Bathroom Market

The timeline below combines documented building-program milestones with broader fixture-market developments. It provides context for changing customer expectations without claiming that a single program or technology caused the review patterns observed in the proprietary dataset.

Historical bathroom fixture technology timeline
1995–1999

Design, Finish & Green-Building Foundations

The report's earliest customer records begin in this period. Bathroom selection remained strongly associated with visible style, finish, value, and conventional mechanical operation. In the broader built environment, the U.S. Green Building Council developed LEED 1.0 by 1998 and began pilot testing, helping establish a more structured language for building performance and environmental responsibility.

2000–2005

Coordinated Luxury & Expanding Performance Expectations

Bathrooms increasingly became designed environments with coordinated faucets, shower trim, accessories, stone, tile, and decorative finishes. Customers expected fixtures to contribute visibly to the overall interior while still delivering dependable mechanical performance and straightforward installation.

2006–2009

Water Efficiency Becomes a Consumer Standard

EPA officially launched WaterSense on June 12, 2006. The program connected reduced water use with independently verified performance and made efficiency easier for consumers and professionals to identify. Bathroom faucets and faucet accessories were among the early labeled product categories.

2010–2013

Shower Efficiency & Performance Testing

EPA released its first WaterSense showerhead specification in March 2010. The program required labeled showerheads to meet water-efficiency criteria while also demonstrating satisfactory performance, reinforcing the market principle that lower flow should not mean an unacceptable shower experience.

2014–2017

Wellness Enters the Building Standard Conversation

The International WELL Building Institute launched WELL Building Standard v1.0 in October 2014. Its focus on human health and wellbeing expanded the building-performance discussion beyond environmental impact alone and supported a broader market interest in water quality, comfort, hygiene, lighting, and spaces designed around the occupant.

2018–2020

Smart Controls, Touch-Free Use & Health Awareness

Connected controls, presets, touchless activation, digital interfaces, and system integration became more visible across residential and commercial bathroom products. IWBI introduced the WELL v2 pilot in 2018 and formally launched WELL v2 in September 2020, reflecting the continued expansion of health-centered building practice.

2021–2023

The Bathroom Becomes a Personal Wellness Environment

Renovation demand, at-home wellness, larger shower systems, specialty finishes, and technology-supported comfort increased the importance of complete-system planning. Customers increasingly evaluated the interaction among design, controls, spray functions, installation, and long-term support.

2024–2026

Accessibility, Wellness & Integrated Experience

Houzz's 2025 bathroom research found that 68% of surveyed homeowners considered special needs in their projects, while 25% used the primary bathroom for rest and relaxation. The contemporary market increasingly combines accessibility, future planning, wellness, visual personalization, water performance, and professional installation within the same project.

Evolution of bathroom fixture customer expectations
SECTION 5.1.3

Customer Expectations Became More Interdependent

The evolution of bathroom fixtures is not simply a progression from basic products to more features. The more important change is that customer expectations became interconnected. Design now depends on finish coordination. Performance depends on water supply and valve selection. Smart operation depends on power, commissioning, and service access. Accessibility depends on layout, reach, control placement, and future use.

This interdependence helps explain why installation, delivery, missing components, and documentation can have such a large effect on ratings. A modern fixture may be only one visible element of a concealed and carefully sequenced system.

The market's central challenge is therefore not merely adding technology. It is delivering greater capability without creating unmanageable complexity for designers, installers, facility teams, or end users.

Earlier Expectation Expanded Modern Expectation New Customer-Risk Area
Attractive finish Coordinated finish across multiple fixtures and accessories Batch variation, care requirements, construction damage
Adequate water flow Efficient but satisfying spray across one or more outlets Supply limitations, pressure assumptions, outlet imbalance
Basic installation Coordinated plumbing, electrical, waterproofing, and controls Trade sequencing, missing details, inaccessible components
Mechanical operation Thermostatic, touchless, digital, or programmable control Setup, power, calibration, user-interface complexity
Immediate usability Accessibility, wellness, adaptability, and lifecycle service Future compatibility, parts availability, maintenance access
SECTION 5.1.4

Greater Capability Creates Greater Responsibility

Each major advance creates a corresponding obligation for the manufacturer, seller, specifier, installer, and operator. The benefit of technology depends on whether the complete delivery system supports it.

Bathroom fixture technology and lifecycle responsibility

Efficiency

Document realistic flow, performance, supply conditions, and applicable product certification.

Technology

Provide wiring, commissioning, troubleshooting, interface, and safe service-access information.

Accessibility

Coordinate control reach, operation, entry, seating, hand-shower use, temperature safety, and layout.

Lifecycle Support

Maintain replacement parts, product records, service guidance, and accessible concealed components.

SECTION 5.1.5

Five Historical Conclusions

1. Design remained fundamental. New technologies expanded the experience, but visible style and finish continued to shape customer attention.
2. Performance became measurable. Efficiency programs increasingly connected lower consumption with tested and certified performance.
3. Bathrooms became human-centered. Accessibility, wellness, safety, and adaptability expanded the meaning of a successful project.
4. Complexity shifted risk upstream. Product content, design coordination, and pre-installation planning became increasingly important.
5. Ownership became a lifecycle experience. Maintenance, replacement parts, technical support, and recovery now influence the long-term value of the fixture.
Historical conclusions from thirty years of bathroom fixture evolution
Transition to annual bathroom fixture review volume and rating trends
NEXT: SECTION 5.2

Review Volume, Rating Stability & Historical Confidence

The next section will chart annual review volume, average ratings, high-rating share, and evidence reliability—clearly separating low-volume early years from the stronger modern analytical periods.

Section 5.1 Source Notes

U.S. Green Building Council, mission and historical timeline: https://www.usgbc.org/about/mission-vision

U.S. EPA WaterSense, accomplishments and history: https://www.epa.gov/watersense/accomplishments-and-history

U.S. EPA WaterSense, showerhead specification history: https://www.epa.gov/watersense/showerheads

International WELL Building Institute, WELL v1.0 launch: https://resources.wellcertified.com/articles/the-international-well-building-institute-launches-the-well-building-standard-version-1-0/

International WELL Building Institute, WELL v2 formal launch: https://resources.wellcertified.com/press-releases/international-well-building-institute-formally-launches-well-v2/

Houzz Research, 2025 U.S. Houzz Bathroom Trends Study: https://www.houzz.com/magazine/2025-u-s-houzz-bathroom-trends-study-stsetivw-vs~183227801

14,367

Total Records

Complete dated review records included in the annual volume analysis.

32

Calendar Years

Years represented from 1995 through the 2026 year-to-date period.

2015

Strong-Volume Era

First year exceeding 500 records, supporting stronger annual comparisons.

2026 YTD

Incomplete Period

Records currently extend through June 26, 2026 and are not a full-year comparison.

Historical caution: Annual results before 2014 are based on fewer than 50 records per year. Those averages can shift substantially from only one or two reviews and should not be treated as stable market benchmarks.

SECTION 5.2.1

The Dataset Becomes Analytically Stronger After 2014

The historical record is extremely sparse through 2013. Annual volume first reaches 178 records in 2014, rises to 572 in 2015, and exceeds 1,000 records for the first time in 2017. From 2017 onward, most complete years contain approximately 939 to 1,675 reviews.

This change matters more than simple database growth. Larger samples reduce the influence of individual reviews and make annual averages, rating distributions, and topic proportions more stable. The modern period therefore carries substantially greater evidentiary weight than the early historical record.

The 2026 year-to-date count reaches 1,748 records through June 26, already exceeding every prior full calendar year. Because the period is incomplete and its rating mix differs sharply from earlier years, it should be reported separately rather than treated as a final annual result.

Growth in annual bathroom fixture review volume

Annual Review Volume: 2014–2026

2014
178
2015
572
2016
790
2017
1,033
2018
995
2019
1,372
2020
1,110
2021
939
2022
1,556
2023
1,675
2024
980
2025
1,112
2026*
1,748

*2026 is year-to-date through June 26 and is not directly comparable with completed calendar years.

SECTION 5.2.2

Modern Annual Ratings Remain High but Not Uniform

From 2015 through 2025, annual average ratings range from 4.561 to 4.853. The variation is meaningful, but every complete year remains strongly positive. The annual rating should be read together with the five-star share and lower-rating share because two years can have similar averages while containing different rating distributions.

Historical bathroom fixture rating stability
4.853

Highest Complete-Year Average

Recorded in 2023 across 1,675 reviews.

4.561

Lowest Complete-Year Average

Recorded in 2018 across 995 reviews.

88.7%

Highest Five-Star Share

Recorded in 2023 among high-volume modern years.

97.5%

2023 Four-or-Five-Star Share

Confirms that the high annual average reflects a broad positive distribution.

SECTION 5.2.3

Annual Rating Profile: 2014–2026

This table focuses on the period with meaningful annual volume. CEEF™ grades reflect record count only at this stage; final findings may be adjusted for text quality, product mix, and other methodological controls.

Year Reviews Average Five Stars Four or Five Three or Lower Evidence
2014 178 4.674 77.0% 92.1% 7.9% C
2015 572 4.673 76.0% 93.0% 7.0% A
2016 790 4.814 85.4% 97.1% 2.9% A
2017 1,033 4.640 75.0% 94.2% 5.8% A
2018 995 4.561 62.7% 95.5% 4.5% A
2019 1,372 4.643 72.7% 94.1% 5.9% A
2020 1,110 4.733 81.1% 95.2% 4.8% A
2021 939 4.734 78.6% 96.7% 3.3% A
2022 1,556 4.690 75.8% 95.4% 4.6% A
2023 1,675 4.853 88.7% 97.5% 2.5% A
2024 980 4.820 85.8% 96.3% 3.7% A
2025 1,112 4.725 77.2% 95.6% 4.4% A
2026 YTD 1,748 4.602 61.3% 99.1% 0.9% A*

*2026 carries a large sample but remains an incomplete year and should be treated as provisional.

Provisional 2026 bathroom fixture rating distribution
SECTION 5.2.4

The 2026 Average Declines Without a Surge in Low Ratings

Through June 26, the 2026 average rating is 4.602, lower than every complete year since 2018. Viewed alone, this could be misinterpreted as a broad decline in satisfaction. The distribution shows a more nuanced result.

Approximately 99.1% of 2026 records carry four or five stars, while only 0.9% are three stars or lower. The average is reduced primarily because the five-star share falls to 61.3% and a much larger portion of records carry four stars.

This may represent a change in review-collection behavior, rating conventions, product mix, customer expectations, or record-processing practices rather than a conventional rise in dissatisfaction. Further investigation is required before interpreting 2026 as a market trend.

PROVISIONAL FINDING

Large sample, incomplete year, unusual rating composition, and additional validation required before final publication.

SECTION 5.2.5

Historical Confidence by Analytical Era

Historical confidence levels for bathroom fixture review research

1995–2013

EXPLORATORY

Very small annual samples. Useful for preserving historical continuity, not for precise annual comparisons.

2014

MODERATE

178 records provide a meaningful transitional baseline but remain more sensitive to product mix.

2015–2025

STRONG TO VERY STRONG

Every year contains at least 572 reviews, supporting robust descriptive comparisons.

2026 YTD

LARGE BUT PROVISIONAL

High volume supports analysis, but the incomplete period and unusual rating mix require separate treatment.

SECTION 5.2.6

Six Longitudinal Findings

1. Volume changed the quality of evidence. Reliable year-level interpretation becomes substantially stronger beginning in 2015.
2. Modern ratings remain consistently high. Every complete year from 2015–2025 averages above 4.56 stars.
3. Five-star share is more volatile than low-rating share. Annual averages often move because customers shift between four and five stars.
4. 2023 is the strongest complete year. It combines the highest average, highest five-star share, and one of the largest samples.
5. Early historical averages are unstable. Apparent perfect scores in low-volume years should not be reported as superior performance.
6. 2026 requires a separate explanation. Its lower average reflects more four-star ratings, not a broad increase in severe dissatisfaction.
Longitudinal bathroom fixture review findings
Transition to changing bathroom fixture customer priorities
NEXT: SECTION 5.3

How Customer Priorities Changed Over Time

The next section will compare topic frequency across historical periods to determine whether design, installation, delivery, finish, water performance, technology, and support became more or less prominent in customer language.

Section 5.2 Methodology Note

Annual counts and rating distributions use all 14,367 records with valid confirmed original review dates and numerical ratings. Percentages may differ slightly from displayed values because of rounding.

Annual averages are descriptive. They are not adjusted for changes in product mix, review solicitation, customer composition, retrospective imports, text standardization, or other administrative practices. The 2026 period is incomplete through June 26, 2026.

SECTION 5.3 · CUSTOMER-LANGUAGE EVOLUTION

How Customer Priorities Changed Over Time

Customer-review language became broader and more operational over time. Design remained central, but later reviews increasingly discussed installation, materials, reliability, finish, water performance, delivery, and customer support. These shifts suggest that customers progressively evaluated the complete ownership experience rather than appearance or price alone.

Evolution of bathroom fixture customer priorities
LONGITUDINAL FINDING

Customer attention shifted from product selection toward system ownership.

Later reviews are more likely to discuss how the fixture is built, installed, operated, delivered, supported, and maintained.

Period Comparison Method

Topic percentages are calculated from the 11,381 review texts eligible for language analysis. To reduce instability from individual years, records are grouped into broader periods: 1995–2013, 2014–2016, 2017–2019, 2020–2022, 2023–2025, and 2026 year-to-date. The earliest period remains exploratory, while 2026 is reported separately because its language profile is unusually different and the year is incomplete.

SECTION 5.3.1

The Complete Ownership Experience Became More Visible

Between 2014–2016 and 2023–2025, the share of eligible reviews mentioning installation increased from 34.4% to 57.8%. Reliability and daily-use language rose from 32.6% to 56.5%, while build and materials increased from 24.1% to 52.7%.

Finish and color increased from 30.0% to 53.7%, delivery and packaging from 15.9% to 32.1%, and water performance from 13.8% to 26.1%. Customer-support language produced the largest shift, rising from 4.1% to 41.0%.

These increases do not prove that customers suddenly began caring about these subjects. They show that later review records describe more stages of the ownership journey and use a more detailed operational vocabulary.

Complete bathroom fixture ownership experience

Largest Topic Shifts: 2014–2016 vs. 2023–2025

+36.9

Customer Support

4.1% to 41.0% of eligible period reviews.

+28.6

Build & Materials

24.1% to 52.7% of eligible period reviews.

+23.9

Reliability & Use

32.6% to 56.5% of eligible period reviews.

+23.7

Finish & Color

30.0% to 53.7% of eligible period reviews.

+23.4

Installation

34.4% to 57.8% of eligible period reviews.

Values represent percentage-point change, not percentage growth.

SECTION 5.3.2

Customer Topic Frequency by Period

The table shows the share of eligible review texts in each period that contain language assigned to the selected customer-experience topic.

Bathroom fixture customer topic frequency by historical period
Period Eligible Reviews Design Install Reliability Materials Finish Delivery Support Water
1995–2013* 83 49.4% 34.9% 42.2% 54.2% 45.8% 10.8% 2.4% 24.1%
2014–2016 776 60.3% 34.4% 32.6% 24.1% 30.0% 15.9% 4.1% 13.8%
2017–2019 2,547 57.1% 33.7% 32.8% 29.2% 33.4% 15.3% 7.6% 9.7%
2020–2022 3,265 54.2% 43.5% 31.6% 41.1% 37.0% 20.5% 13.6% 18.1%
2023–2025 3,226 61.0% 57.8% 56.5% 52.7% 53.7% 32.1% 41.0% 26.1%
2026 YTD** 1,484 46.4% 63.0% 75.3% 64.6% 55.3% 64.6% 46.0% 56.6%

*1995–2013 is exploratory because only 83 eligible texts span the entire period. **2026 is incomplete and has an unusually different topic profile requiring validation.

Design remains central in bathroom fixture customer reviews
SECTION 5.3.3

Design Remained Stable While Other Priorities Caught Up

Design and appearance remained one of the most stable high-frequency subjects. It appears in 60.3% of eligible reviews from 2014–2016 and 61.0% from 2023–2025, a difference of only 0.7 percentage points.

The important historical change is therefore not that design disappeared. Instead, installation, reliability, materials, finish, delivery, support, and water performance became almost as visible as design in later customer language.

The market appears to have moved from a design-led evaluation toward a design-plus-performance model. Customers continue to value appearance, but they increasingly judge whether the complete system justifies that appearance through quality, usability, and support.

SECTION 5.3.4

Support Became Part of the Product Experience

Customer-support language increased more than any other major topic in the period comparison. This may reflect greater product complexity, improved review detail, stronger service documentation, or changes in how reviews were collected and edited. Regardless of cause, modern customers increasingly describe the support surrounding the fixture.

Customer support as part of bathroom fixture ownership

Pre-Purchase Support

Compatibility, finish selection, dimensions, included components, and lead-time guidance.

Installation Support

Rough-in clarification, diagrams, technical answers, commissioning, and troubleshooting.

Ownership Support

Maintenance, replacement parts, finish care, warranty communication, and service guidance.

Recovery Support

Resolution of shipping damage, incorrect items, missing parts, returns, and technical failures.

SECTION 5.3.5

The 2026 Language Profile Is Too Different to Treat as a Normal Trend

In the 2026 year-to-date eligible sample, reliability language appears in 75.3% of reviews, delivery and packaging in 64.6%, materials in 64.6%, installation in 63.0%, and water performance in 56.6%.

Delivery language rises 32.5 percentage points from the 2023–2025 period, while water-performance language rises 30.5 points. At the same time, design falls 14.6 points and value language falls 13.5 points.

Changes of this scale within a partial year may reflect a shift in product mix, review prompts, editorial practices, import procedures, or language standardization. They should be investigated before being described as changes in customer behavior.

RESEARCH STATUS: PROVISIONAL

Large sample, incomplete period, abrupt topic shifts, and possible record-process effects requiring sensitivity testing.

Provisional 2026 bathroom fixture customer language profile
SECTION 5.3.6

What the Priority Evolution Suggests

Design Did Not Lose Importance

Its share remained near 60% in both the 2014–2016 and 2023–2025 comparison periods.

Technical Subjects Expanded

Installation, materials, reliability, finish, and water performance became more visible in later reviews.

Service Became Product Value

Support language increasingly forms part of how customers describe product ownership.

Delivery Became More Visible

Fulfillment and packaging language doubled between the main comparison periods.

Value Stayed Relatively Stable

Price and value rose only 2.9 points between 2014–2016 and 2023–2025.

Recent Data Needs Auditing

2026 topic changes are too abrupt to publish as market behavior without further validation.

Transition to bathroom technology evolution
NEXT: SECTION 5.4

Evolution of Bathroom Technology

The next section will connect customer-language changes with the development of thermostatic systems, rainfall showers, multiple outlets, touchless fixtures, digital controls, smart operation, water efficiency, and wellness-focused bathroom design.

Section 5.3 Methodology Note

Topic percentages use 11,381 review texts that passed the initial language-eligibility controls. A single review may be assigned to several topics, so percentages do not sum to 100%.

Changes in topic frequency may reflect customer priorities, product mix, review length, solicitation practices, language editing, classification sensitivity, or database administration. They are descriptive language trends rather than direct measures of total market demand.

SECTION 5.4 · TECHNOLOGY EVOLUTION

Evolution of Bathroom Technology

Bathroom technology expanded from conventional mechanical fixtures into increasingly integrated systems combining water delivery, temperature control, multiple spray functions, touch-free activation, digital interfaces, efficiency requirements, accessibility, and wellness-oriented design. Each advance expanded customer choice while creating new responsibilities for specification, installation, commissioning, maintenance, and long-term support.

Evolution of bathroom shower and fixture technology
TECHNOLOGY PRINCIPLE

More capability creates more points of coordination.

Product innovation delivers the greatest value when water supply, valves, controls, wiring, drainage, access, installation documentation, and service support are designed as one system.

SECTION 5.4.1

From Mechanical Control to Integrated Experience

Traditional bathroom fixtures concentrated control at a mechanical valve or faucet handle. The user selected hot and cold water, controlled volume, and relied on the building's plumbing conditions to determine the final experience.

Modern systems can add thermostatic regulation, pressure compensation, multiple outlets, programmable temperature, touch-free sensors, digital interfaces, lighting, status displays, automatic shutoff, and connected monitoring. These technologies can improve comfort, safety, hygiene, and control, but they also create more interfaces between the product and the building.

The historical customer-language shift toward installation, reliability, support, water performance, and delivery is consistent with this expansion. As the number of components and dependencies grows, customers become more likely to evaluate the complete system rather than only the visible trim.

Integrated digital bathroom shower control system
01

Mechanical Fixtures

Manual controls, conventional cartridges, single outlets, and straightforward service relationships.

02

Performance Control

Pressure-balancing and thermostatic technology improve temperature consistency and user safety.

03

Multi-Function Systems

Rainfall, waterfall, body sprays, hand showers, diverters, and coordinated outlet control.

04

Digital & Smart Systems

Electronic controls, presets, touch-free operation, sensing, displays, monitoring, and automation.

SECTION 5.4.2

Temperature Control Became a Core Performance Expectation

Pressure-balancing and thermostatic systems changed the shower from a simple mixing function into a controlled thermal experience. Customers increasingly expect stable temperature, predictable adjustment, safe operation, and consistent behavior when pressure conditions change elsewhere in the building.

Thermostatic shower technology and temperature control

Pressure Balance

Responds to pressure changes between hot and cold supplies to reduce sudden temperature shifts.

Thermostatic Control

Regulates mixed-water temperature and can separate temperature selection from volume control.

Commissioning

Requires correct supply orientation, flushing, temperature setting, calibration, and verification.

Service Access

Cartridges, filters, check valves, and concealed components should remain maintainable after installation.

Rainfall and multi-outlet shower technology
SECTION 5.4.3

Rainfall and Multi-Outlet Systems Changed Hydraulic Planning

Large rain showers, hand showers, body sprays, waterfall outlets, and dual-head systems expanded the shower from a single discharge point into a multi-outlet environment. This introduced new design questions involving simultaneous operation, pipe sizing, valve capacity, water-heater recovery, pressure, flow distribution, drainage, waterproofing, and structural support.

EPA's WaterSense showerhead criteria illustrate the industry's effort to balance efficiency and user satisfaction. WaterSense-labeled showerheads must use no more than 2.0 gallons per minute and meet performance requirements involving spray force and coverage. The specification includes rain showers and hand-held showers within its scope while distinguishing body sprays.

The standardization of performance testing is important because customer perceptions of “pressure” often combine several different attributes: inlet pressure, total flow, nozzle geometry, spray force, coverage, droplet character, outlet size, and the number of outlets operating simultaneously.

Shower Criteria

Multi-Outlet Hydraulic Dependency Matrix

Technology Primary Benefit Critical Dependency Possible Customer Friction
Large Rain Shower Broad overhead coverage Flow distribution, pressure, mounting, drainage Uneven spray, low perceived force, overspray
Body Sprays Directional multi-level coverage Pipe layout, balancing, outlet alignment Unequal output, poor positioning, low combined flow
Hand Shower Flexibility, cleaning, accessibility Hose length, bracket position, diverter operation Awkward reach, hose interference, switching confusion
Simultaneous Outlets Immersive multi-function use Valve capacity, supply flow, heater recovery Performance drop when multiple functions operate
SECTION 5.4.4

Touchless Technology Shifted Attention to Sensing and Reliability

Touchless faucets and automatic dispensers replaced a simple mechanical interaction with a sensing, power, control, and valve sequence. The customer experience now depends on detection range, activation speed, false-trigger resistance, shutoff timing, battery or power condition, solenoid reliability, and access for service.

Touchless bathroom technology and sensor reliability

Sensor Detection

Range, target recognition, reflective surfaces, ambient light, and user-position variability.

Power Architecture

Battery life, hardwired supply, transformer location, backup power, and maintenance intervals.

Valve Response

Activation delay, shutoff behavior, debris sensitivity, filter condition, and solenoid serviceability.

Service Mode

Cleaning, troubleshooting, manual override, component replacement, and diagnostic access.

SECTION 5.4.5

Digital Controls Added Precision—and Software-Like Expectations

Digital shower controls can provide temperature presets, outlet selection, timers, status displays, memory functions, and coordinated operation. These capabilities bring convenience and repeatability but also introduce expectations traditionally associated with electronic products: intuitive interfaces, reliable startup, clear error states, reset procedures, and continued compatibility.

The installation environment becomes especially important. Power supply, transformer position, low-voltage wiring, cable routing, controller location, valve access, waterproof boundaries, and commissioning must be resolved before walls and ceilings are closed.

Smart capability should therefore be evaluated by more than feature count. The stronger measure is whether the system remains understandable, maintainable, and recoverable when a power interruption, component fault, control reset, or future service event occurs.

Digital and smart shower control technology

Digital System Readiness Checklist

Power Confirmed

Voltage, transformer, circuit location, access, protection, and backup strategy documented.

Controls Coordinated

Interface location, user reach, visibility, cable length, and waterproof separation verified.

Access Preserved

Valve, controller, filters, connections, and replaceable electronics remain serviceable.

Commissioning Planned

Flushing, pairing, temperature setup, outlet testing, fault checks, and handover completed.

SECTION 5.4.6

Efficiency Standards Made Performance More Measurable

EPA WaterSense develops specifications through a public process and evaluates both water savings and user-relevant performance. WaterSense-labeled products must be independently certified, and labeled showerheads must satisfy efficiency and performance criteria rather than flow limits alone.

Performance Dimension Why It Matters Customer Interpretation
Rated Flow Establishes water-use limits under defined test conditions How much water the outlet is designed to deliver
Low-Pressure Flow Evaluates performance when supply pressure is reduced Whether the shower feels usable in less favorable conditions
Spray Force Measures delivered spray intensity under a defined method Often described informally as pressure or strength
Spray Coverage Evaluates how water is distributed across the spray pattern Whether the shower feels broad, concentrated, or uneven
Bathroom wellness technology and human-centered design
SECTION 5.4.7

Technology Expanded Beyond Function Into Human Experience

The development of wellness-oriented bathrooms expanded the role of technology beyond basic operation. Temperature stability, lighting, sound, spray selection, hand-shower flexibility, touch-free use, cleaner interfaces, and accessibility can all contribute to comfort and ease of use.

WELL's water concept emphasizes water quality, treatment, and testing within the built environment, while broader WELL principles frame building performance around occupant health and wellbeing. This supports a more complete view of bathroom quality in which water delivery, safety, cleanliness, comfort, and human interaction are evaluated together.

The strongest technology is therefore not necessarily the system with the largest number of features. It is the system that converts technical capability into a dependable, understandable, and maintainable user experience.

WELL Water
SECTION 5.4.8

Technology Value Depends on Delivery Readiness

The customer receives the benefit only when the full chain—from product content through installation and service—is prepared to support the technology.

01

Specified Correctly

The selected product matches the intended use, plumbing, power, structure, drainage, and project conditions.

02

Delivered Completely

Every required valve, fitting, control, cable, bracket, transformer, and finish component arrives correctly.

03

Installed & Commissioned

The system is flushed, calibrated, programmed, tested, and verified before handover.

04

Supported Long-Term

Documentation, replacement parts, maintenance access, diagnostics, and technical support remain available.

Transition to customer language evolution analysis
NEXT: SECTION 5.5

Evolution of Customer Language

The next section will examine how customer vocabulary changed—from conventional references to faucets, finishes, and installation toward rainfall, thermostatic control, touchless operation, smart systems, wellness, and serviceability.

Section 5.4 Source Notes

U.S. EPA WaterSense, Showerheads: https://www.epa.gov/watersense/showerheads

U.S. EPA WaterSense, Product Specifications: https://www.epa.gov/watersense/product-specifications

U.S. EPA WaterSense, Specification Development: https://www.epa.gov/watersense/how-are-watersense-specifications-developed

ASME A112.18.1/CSA B125.1, Plumbing Supply Fittings: https://www.asme.org/codes-standards/find-codes-standards/plumbing-supply-fittings-%28with-10-18-errata%29

WELL Building Standard, Water Concept: https://standard.wellcertified.com/v13/water

SECTION 5.5 · CUSTOMER VOCABULARY

Evolution of Customer Language

The words customers use reveal how the bathroom-fixture experience is changing. Earlier review language is generally narrower and more product-centered, while later records contain more references to sensing, maintenance, digital controls, finishes, installation, service, and system performance. Vocabulary trends must be interpreted carefully because they can reflect product mix, review prompts, editorial practices, and changing record detail as well as genuine customer priorities.

Evolution of customer language in bathroom fixture reviews
LANGUAGE FINDING

Customer vocabulary moved from visible product features toward operation, service, and lifecycle experience.

Modern review records are more likely to describe sensing, installation, maintenance, support, finish coordination, and technical behavior.

Vocabulary Analysis Method

Selected words and phrase families were searched within the 11,381 review texts eligible for language analysis. Related variants were grouped where appropriate—for example, “touchless,” “sensor,” and “automatic faucet,” or “maintenance,” “maintain,” “cleaning,” and “serviceability.” Percentages indicate the share of eligible reviews in each period containing at least one matching term. They are language signals, not direct measures of product sales or total market demand.

SECTION 5.5.1

The Vocabulary of Ownership Became More Technical

Faucet language appears in 31.6% of eligible reviews from 2014–2016 and 68.6% from 2023–2025. This does not necessarily mean faucets gained market share; it may partly reflect changes in product mix or more detailed product descriptions. What matters is that later reviews identify the product and its operating context more explicitly.

Installation-related vocabulary rises from 31.2% to 51.7% across the same periods, while support-related vocabulary rises from 3.6% to 32.7%. Maintenance language increases from 5.3% to 41.3%.

Together, these shifts show that later review records are more likely to describe what happens after product selection: how the fixture is installed, serviced, cleaned, supported, and kept operational.

Customer language shifting toward bathroom system ownership

Selected Vocabulary Shifts: 2014–2016 vs. 2023–2025

+57.1

Touchless / Sensor

10.3% to 67.4% of eligible period reviews.

+36.0

Maintenance

5.3% to 41.3% of eligible period reviews.

+29.1

Customer Support

3.6% to 32.7% of eligible period reviews.

+20.5

Installation Terms

31.2% to 51.7% of eligible period reviews.

+37.0

Faucet

31.6% to 68.6% of eligible period reviews.

Values are percentage-point changes in language frequency and may reflect product mix, review detail, or editorial practices.

SECTION 5.5.2

Technology Vocabulary Expanded Gradually—Except for Sensor Language

Words such as digital, smart, thermostatic, rainfall, LED, and touchless appear at different rates and follow different historical patterns. Touchless and sensor terminology shows the largest increase, while digital, smart, and thermostatic terms grow more gradually.

Evolution of smart, digital, touchless, and thermostatic bathroom language
Period Touchless / Sensor Digital Smart Thermostatic Rainfall LED / Lighting Spa / Wellness
2014–2016 10.3% 1.5% 0.1% 0.4% 6.1% 12.6% 3.7%
2017–2019 14.2% 1.5% 0.3% 0.9% 3.9% 10.5% 1.3%
2020–2022 24.5% 1.3% 1.2% 2.1% 8.1% 13.0% 2.1%
2023–2025 67.4% 2.9% 3.5% 2.4% 2.0% 4.9% 2.4%
2026 YTD* 59.0% 2.6% 3.4% 3.8% 3.4% 12.7% 4.0%

*2026 is incomplete. Touchless/sensor frequency is especially sensitive to changes in product mix and standardized technical wording.

Changing bathroom fixture finish vocabulary
SECTION 5.5.3

Finish Vocabulary Became More Specific

General gold terminology appears in 9.3% of eligible reviews from 2014–2016 and 13.0% from 2023–2025. Brushed-gold language rises from 0.4% to 3.3%, while matte-black language increases from 0.3% to 3.1%.

Chrome language also rises, from 3.4% to 6.7%, indicating that the change is not simply a replacement of chrome by newer finishes. Instead, later review records appear more likely to name the selected finish explicitly.

This increased specificity matters because finish is no longer only a color choice. Customers may evaluate undertone, sheen, coordination across components, resistance to spotting, cleaning requirements, and consistency between separately packaged items.

Finish Term 2014–2016 2020–2022 2023–2025 2026 YTD
Chrome 3.4% 4.6% 6.7% 8.4%
Gold 9.3% 6.9% 13.0% 13.4%
Brushed Gold 0.4% 1.5% 3.3% 3.1%
Matte Black 0.3% 0.9% 3.1% 6.3%
SECTION 5.5.4

What Vocabulary Change Can—and Cannot—Tell Us

Interpreting changing bathroom fixture customer vocabulary

It Can Show Visibility

Which words and concepts appear more frequently in the recorded customer narrative.

It Can Suggest Complexity

Growth in installation, maintenance, and support language may reflect a more involved ownership journey.

It Cannot Prove Demand

A higher word frequency does not establish total sales growth, market share, or universal buyer preference.

It Requires Process Controls

Product mix, review prompts, imports, editing, and standardized descriptions can materially influence vocabulary.

SECTION 5.5.5

A Four-Stage Language Maturity Model

Stage 1 · Product Identification: faucet, shower, sink, chrome, gold, price, and appearance.
Stage 2 · Installation Experience: install, plumbing, instructions, rough-in, mounting, and included components.
Stage 3 · Technical Performance: sensor, thermostatic, digital, pressure, flow, reliability, and controls.
Stage 4 · Lifecycle Ownership: support, maintenance, cleaning, replacement parts, serviceability, and recovery.
Bathroom fixture customer language maturity model
SECTION 5.5.6

Six Customer-Language Findings

Sensor Language Surged

Touchless and sensor terminology shows the largest measured vocabulary increase.

Maintenance Became Visible

Later records discuss cleaning, maintenance, and serviceability much more frequently.

Support Entered the Narrative

Customer service and technical support became a larger part of how ownership is described.

Finish Terms Became Specific

Brushed gold and matte black appear more frequently in later review periods.

Smart Terms Grew Slowly

Digital, smart, and thermostatic language increased, but remains far less common than sensor terminology.

2026 Needs Validation

Unusually high maintenance and technical-language rates may reflect process changes rather than market behavior.

Transition to satisfaction trend analysis
NEXT: SECTION 5.6

Satisfaction Trends & Rating Composition

The next section will examine how five-star, four-star, and lower-rating shares changed over time and why average ratings alone can conceal important shifts in customer response.

Section 5.5 Methodology Note

Vocabulary frequencies use the 11,381 review texts eligible for language analysis. Phrase families were defined through documented case-insensitive keyword and regular-expression rules.

Vocabulary frequency is sensitive to review length, product mix, terminology changes, editing, solicitation prompts, imports, and standardized technical wording. Findings describe the recorded language and do not independently establish market demand, technology adoption, or sales trends.

SECTION 5.6.1 · RATING FOUNDATIONS

Why Nearly Every Industry Uses Average Ratings

Average ratings are used because they transform thousands of individual opinions into one immediately understandable number. A score such as 4.7 out of 5 can be read quickly, compared easily, displayed consistently, and incorporated into product pages, reports, dashboards, rankings, procurement reviews, and customer-experience summaries.

Average customer ratings used across bathroom fixture markets
THE POWER OF ONE NUMBER

Average ratings make complex customer feedback easy to communicate.

Their strength is simplicity. Their weakness is that the same simplicity can hide important differences in consistency, distribution, timing, sample size, and customer experience.

WHY AVERAGES DOMINATE

Averages Solve a Real Communication Problem

Customer-review databases can contain thousands or millions of individual ratings. Reading every review is impossible for most shoppers, buyers, facility teams, designers, procurement professionals, and executives. The arithmetic mean offers a practical summary by combining all recorded star values into one score.

This single score supports fast comparison. A buyer can immediately see that one product averages 4.8 stars while another averages 4.3. A retailer can rank products. A manufacturer can track changes over time. A procurement team can establish minimum rating thresholds. A customer-experience group can monitor broad performance.

The average is therefore not a poor metric. It is an efficient metric. The problem begins only when it is treated as a complete description of customer satisfaction rather than as one summary measure within a larger evidence set.

Average ratings simplifying complex customer review data

Why Organizations Prefer Average Ratings

01

Immediate Meaning

Most readers understand that a score near five represents broadly positive recorded sentiment.

02

Fast Comparison

Products, suppliers, locations, time periods, and service teams can be compared using the same scale.

03

Compact Display

One number fits easily into search results, product cards, reports, dashboards, and mobile interfaces.

04

Trend Monitoring

Yearly, quarterly, or monthly averages can reveal directional changes in recorded satisfaction.

05

Decision Support

Buyers and procurement teams can use rating thresholds as one screening factor among many.

THE ARITHMETIC MEAN

How an Average Rating Is Calculated

Each recorded star value is added together and divided by the number of ratings. The method gives every review one equal numerical contribution to the final score.

Arithmetic mean and average customer rating explanation

Simple Rating Example

5★
5★
4★
4★
3★
(5 + 5 + 4 + 4 + 3) ÷ 5 = 4.2

The average communicates the central numerical result, but it does not explain how the five individual experiences differ.

Average ratings used by retailers, hospitality, procurement, and manufacturers
CROSS-INDUSTRY USE

One Metric Serves Many Different Decisions

Retail platforms use average ratings to help shoppers compare products quickly. Hospitality businesses use them to summarize guest experience. Transportation platforms use them to evaluate drivers, hosts, or service providers. Employers use average survey scores to monitor engagement. Manufacturers use them to track product reception.

In building products, average ratings may influence consumer selection, dealer confidence, product positioning, internal quality reviews, and customer-service priorities. They can also support early identification of a change in recorded satisfaction.

The same metric can therefore support very different decisions. That flexibility is one reason average ratings have become nearly universal.

Industry or Function How Average Ratings Are Used What Additional Context Is Needed
E-Commerce Product comparison, sorting, trust signals, and recommendation systems Review count, recency, verified status, distribution, and product version
Hospitality Property performance, guest experience, service comparisons Location, stay type, season, service area, and complaint categories
Manufacturing Product reception, quality monitoring, portfolio comparisons Failure type, production batch, product category, and installation conditions
Procurement Early screening of suppliers, products, and service providers Technical compliance, warranty, lifecycle cost, support, and risk
Customer Experience Monitoring broad satisfaction and identifying directional change Topic analysis, root causes, trend stability, and recovery outcomes
THE CENTRAL LIMITATION

An Average Compresses the Story

The average preserves the total numerical value of all ratings, but it removes most of the structure surrounding them. It does not show whether ratings are tightly concentrated, widely dispersed, improving, declining, recent, outdated, or based on a large or small sample.

Limitations of average customer ratings

Distribution Hidden

The same average can result from very different combinations of five-, four-, three-, two-, and one-star ratings.

Sample Size Hidden

A 4.8 average based on 10 reviews is not equivalent in evidentiary strength to 4.8 based on 10,000 reviews.

Time Hidden

A current average may combine old and new reviews even when the product, process, or customer expectation has changed.

Cause Hidden

The number does not reveal whether dissatisfaction came from product quality, delivery, installation, support, or expectation mismatch.

CORRECT USE

The Average Should Start the Analysis—Not End It

A well-designed customer-experience study should retain the average because it is useful, familiar, and comparable. It should then place that average beside the rating distribution, sample size, historical trend, topic composition, evidence quality, and concentration of lower ratings.

For bathroom fixtures, this broader view is especially important because the final rating may reflect more than the physical product. Delivery condition, missing components, installation documentation, plumbing compatibility, water pressure, finish expectations, technical support, and return handling can all influence the recorded score.

The purpose of deeper analysis is not to replace the average. It is to explain what the average represents.

Average rating as the starting point for deeper customer analysis

Average Rating Decision Framework

Step 1 · Read the Average

Use the score as the broadest summary of recorded customer sentiment.

Step 2 · Check Volume

Confirm how many reviews support the displayed rating.

Step 3 · Inspect Distribution

Compare five-, four-, three-, two-, and one-star shares.

Step 4 · Review Time

Determine whether the rating is stable, improving, declining, or incomplete.

Step 5 · Identify Causes

Use review topics to understand what is influencing customer perception.

REPORT APPROACH

A Multi-Layer Satisfaction Analysis

This study retains the familiar average rating while adding the information required to interpret it responsibly.

Multi-layer bathroom fixture satisfaction analysis

Average Rating

The familiar high-level summary.

Rating Composition

The proportion of each star level behind the average.

Historical Stability

How consistently ratings perform across time.

Sample Confidence

How much evidence supports the result.

Customer Topics

What product or service experiences appear inside the ratings.

Evidence Quality

Whether the underlying records are suitable for each type of conclusion.

Transition to comparing different rating distributions
NEXT: SECTION 5.6.2

One Number Can Describe Very Different Customer Experiences

The next section will compare products with identical or similar average ratings but very different five-star, four-star, and lower-rating distributions.

Section 5.6.1 Methodology Note

This section explains the arithmetic mean as a general descriptive statistic. The examples are illustrative and are not drawn from a specific product or annual subset of the proprietary review database.

Later sections will use actual rating distributions, sample sizes, historical periods, and customer-language topics from the reviewed dataset to show why the average should be interpreted with additional evidence.

SECTION 5.6.2 · RATING DISTRIBUTION

One Number Can Describe Very Different Customer Experiences

Two products can display the same average rating while producing very different patterns of customer satisfaction. The average preserves the total numerical score, but it does not reveal whether customers agree closely, divide into opposing groups, or cluster around several different experiences.

Different customer experiences hidden behind the same average rating
SAME SCORE · DIFFERENT STORY

A 4.0 average can represent consistency, compromise, or polarization.

The difference appears only when the individual star levels are examined.

SIMPLE CONTRAST

The Same Average Can Come From Opposite Patterns

Consider two hypothetical products with an average rating of 4.0 stars.

PRODUCT A

Consistent Satisfaction

5 Stars
0%
4 Stars
100%
3 Stars
0%
2 Stars
0%
1 Star
0%
4.0
Average Rating
PRODUCT B

Polarized Satisfaction

5 Stars
50%
4 Stars
0%
3 Stars
50%
2 Stars
0%
1 Star
0%
4.0
Average Rating

Product A creates a uniform four-star experience. Product B creates two very different customer groups. The average alone treats them as identical.

THREE IDENTICAL AVERAGES

A 4.2 Rating Can Represent Three Different Markets

The following hypothetical profiles all average 4.2 stars, yet each would require a different product, service, and risk interpretation.

Three different customer rating distributions with the same average

Profile 1 · Broad Approval

Most customers choose four stars, with a smaller five-star group and almost no severe dissatisfaction.

20% five-star
80% four-star
0% three-star or lower
4.2 Average

Profile 2 · Mixed Experience

A strong five-star majority is offset by a meaningful three-star group.

60% five-star
0% four-star
40% three-star
4.2 Average

Profile 3 · High Praise, Severe Failures

Most customers are delighted, but a smaller group reports one-star outcomes.

80% five-star
0% four-star
20% one-star
4.2 Average
INTERPRETATION

Each Distribution Requires a Different Response

A broad four-star concentration may suggest dependable performance with room for refinement. A split between five and three stars may indicate inconsistent expectations, product fit, or installation conditions. A combination of many five-star and some one-star reviews may point to rare but severe failures.

These patterns lead to different decisions. The first may require incremental product improvement. The second may require clearer product selection, documentation, or customer education. The third may require urgent root-cause investigation into specific defects, fulfillment failures, or service breakdowns.

The average identifies that overall satisfaction is similar. The distribution identifies what kind of satisfaction is being produced.

Different business responses to different customer rating distributions
Distribution Pattern Possible Interpretation Likely Business Response
Mostly Four-Star Consistent approval without strong delight Refine convenience, finish, packaging, or support details
Five- and Three-Star Split Different expectations, uses, or project conditions Investigate segmentation, installation, selection, and documentation
Five- and One-Star Split Strong success for most customers with severe failures for some Prioritize root-cause, batch, shipping, component, and service analysis
Broad Spread Across All Stars Highly variable experience or mixed product population Separate by product, time, installation type, and customer segment
BATHROOM FIXTURE CONTEXT

Different Ratings Can Reflect Different Stages of the Same Project

A bathroom-fixture rating may summarize more than the fixture itself. The customer may be rating product design, delivery, installation, performance, support, or the entire project outcome.

Bathroom fixture ratings reflecting different stages of the ownership journey

Five-Star Design

The product looks exceptional and coordinates successfully with the intended interior.

Four-Star Installation

The finished result is strong, but installation required more time or clarification than expected.

Three-Star Performance

The product functions, but pressure, flow, spray, or control behavior falls below expectations.

One-Star Fulfillment

A missing component, wrong item, damage, or return problem prevents project completion.

Consistent versus polarized bathroom fixture customer satisfaction
CONSISTENCY

Consistency Is a Different Quality From a High Average

A product can achieve a high average because nearly every customer reports a strong experience. It can also achieve a similar average because many customers are extremely satisfied while a smaller group experiences serious problems.

For consumers, both products may appear similar in a search result. For a manufacturer, contractor, hotel, healthcare facility, or large project buyer, the risk profile is different. A small percentage of severe failures can carry disproportionate cost when products are installed across many rooms or locations.

This distinction between average satisfaction and consistency will become central to the Rating Stability Index™ introduced later in Section 5.6.

QUESTIONS BEYOND THE AVERAGE

What a Responsible Reader Should Ask

Questions to ask beyond an average customer rating
How many reviews support the average?
What percentage is five-star versus four-star?
Are low ratings rare but severe?
Is the distribution concentrated or widely spread?
Has the distribution changed over time?
Which customer-experience topics appear in each rating group?
SECTION CONCLUSIONS

Five Lessons From Identical Averages

1. The average does not reveal agreement. Customers may cluster together or divide sharply.
2. Severe failures can hide inside strong averages. A small one-star group may be masked by many five-star reviews.
3. Consistency and satisfaction are related but different. Both must be measured.
4. Distribution changes the business response. Refinement, segmentation, and urgent failure analysis are not interchangeable.
5. The shape of ratings explains the average. The average alone cannot explain the shape.
Key lessons from identical average ratings
Transition to rating distribution analysis
NEXT: SECTION 5.6.3

Distribution Matters More Than Many People Realize

The next section will explain rating concentration, dispersion, five-star share, lower-rating tails, and why the shape of the distribution is essential to understanding customer satisfaction.

SECTION 5.6.2 · RATING DISTRIBUTION

One Number Can Describe Very Different Customer Experiences

Two products can display the same average rating while producing very different patterns of customer satisfaction. The average preserves the total numerical score, but it does not reveal whether customers agree closely, divide into opposing groups, or cluster around several different experiences.

Different customer experiences hidden behind the same average rating
SAME SCORE · DIFFERENT STORY

A 4.0 average can represent consistency, compromise, or polarization.

The difference appears only when the individual star levels are examined.

SIMPLE CONTRAST

The Same Average Can Come From Opposite Patterns

Consider two hypothetical products with an average rating of 4.0 stars.

PRODUCT A

Consistent Satisfaction

5 Stars
0%
4 Stars
100%
3 Stars
0%
2 Stars
0%
1 Star
0%
4.0
Average Rating
PRODUCT B

Polarized Satisfaction

5 Stars
50%
4 Stars
0%
3 Stars
50%
2 Stars
0%
1 Star
0%
4.0
Average Rating

Product A creates a uniform four-star experience. Product B creates two very different customer groups. The average alone treats them as identical.

THREE IDENTICAL AVERAGES

A 4.2 Rating Can Represent Three Different Markets

The following hypothetical profiles all average 4.2 stars, yet each would require a different product, service, and risk interpretation.

Three different customer rating distributions with the same average

Profile 1 · Broad Approval

Most customers choose four stars, with a smaller five-star group and almost no severe dissatisfaction.

20% five-star
80% four-star
0% three-star or lower
4.2 Average

Profile 2 · Mixed Experience

A strong five-star majority is offset by a meaningful three-star group.

60% five-star
0% four-star
40% three-star
4.2 Average

Profile 3 · High Praise, Severe Failures

Most customers are delighted, but a smaller group reports one-star outcomes.

80% five-star
0% four-star
20% one-star
4.2 Average
INTERPRETATION

Each Distribution Requires a Different Response

A broad four-star concentration may suggest dependable performance with room for refinement. A split between five and three stars may indicate inconsistent expectations, product fit, or installation conditions. A combination of many five-star and some one-star reviews may point to rare but severe failures.

These patterns lead to different decisions. The first may require incremental product improvement. The second may require clearer product selection, documentation, or customer education. The third may require urgent root-cause investigation into specific defects, fulfillment failures, or service breakdowns.

The average identifies that overall satisfaction is similar. The distribution identifies what kind of satisfaction is being produced.

Different business responses to different customer rating distributions
Distribution Pattern Possible Interpretation Likely Business Response
Mostly Four-Star Consistent approval without strong delight Refine convenience, finish, packaging, or support details
Five- and Three-Star Split Different expectations, uses, or project conditions Investigate segmentation, installation, selection, and documentation
Five- and One-Star Split Strong success for most customers with severe failures for some Prioritize root-cause, batch, shipping, component, and service analysis
Broad Spread Across All Stars Highly variable experience or mixed product population Separate by product, time, installation type, and customer segment
BATHROOM FIXTURE CONTEXT

Different Ratings Can Reflect Different Stages of the Same Project

A bathroom-fixture rating may summarize more than the fixture itself. The customer may be rating product design, delivery, installation, performance, support, or the entire project outcome.

Bathroom fixture ratings reflecting different stages of the ownership journey

Five-Star Design

The product looks exceptional and coordinates successfully with the intended interior.

Four-Star Installation

The finished result is strong, but installation required more time or clarification than expected.

Three-Star Performance

The product functions, but pressure, flow, spray, or control behavior falls below expectations.

One-Star Fulfillment

A missing component, wrong item, damage, or return problem prevents project completion.

Consistent versus polarized bathroom fixture customer satisfaction
CONSISTENCY

Consistency Is a Different Quality From a High Average

A product can achieve a high average because nearly every customer reports a strong experience. It can also achieve a similar average because many customers are extremely satisfied while a smaller group experiences serious problems.

For consumers, both products may appear similar in a search result. For a manufacturer, contractor, hotel, healthcare facility, or large project buyer, the risk profile is different. A small percentage of severe failures can carry disproportionate cost when products are installed across many rooms or locations.

This distinction between average satisfaction and consistency will become central to the Rating Stability Index™ introduced later in Section 5.6.

QUESTIONS BEYOND THE AVERAGE

What a Responsible Reader Should Ask

Questions to ask beyond an average customer rating
How many reviews support the average?
What percentage is five-star versus four-star?
Are low ratings rare but severe?
Is the distribution concentrated or widely spread?
Has the distribution changed over time?
Which customer-experience topics appear in each rating group?
SECTION CONCLUSIONS

Five Lessons From Identical Averages

1. The average does not reveal agreement. Customers may cluster together or divide sharply.
2. Severe failures can hide inside strong averages. A small one-star group may be masked by many five-star reviews.
3. Consistency and satisfaction are related but different. Both must be measured.
4. Distribution changes the business response. Refinement, segmentation, and urgent failure analysis are not interchangeable.
5. The shape of ratings explains the average. The average alone cannot explain the shape.
Key lessons from identical average ratings
Transition to rating distribution analysis
NEXT: SECTION 5.6.3

Distribution Matters More Than Many People Realize

The next section will explain rating concentration, dispersion, five-star share, lower-rating tails, and why the shape of the distribution is essential to understanding customer satisfaction.

Section 5.6.2 Methodology Note

All distribution examples in this section are hypothetical and are designed to demonstrate how identical arithmetic means can arise from different rating compositions.

The examples do not describe a specific product, company, or annual subset. Actual proprietary rating distributions will be presented in later sections using the documented review database.

SECTION 5.6.3 · DISTRIBUTION ANALYSIS

Distribution Matters More Than Many People Realize

A rating distribution shows how customer responses are spread across five-, four-, three-, two-, and one-star levels. Unlike the average, the distribution reveals whether satisfaction is concentrated, divided, volatile, or affected by a small but important group of severe negative outcomes.

Rating distribution analysis for bathroom fixture customer reviews
DISTRIBUTION PRINCIPLE

The shape of the ratings explains what the average cannot.

Concentration, dispersion, polarization, and lower-rating tails reveal the consistency and risk behind the headline score.

WHAT DISTRIBUTION ADDS

Distribution Restores the Missing Structure

An average combines all ratings into one value. A distribution keeps the star levels separate. This allows the reader to see whether most customers select the same rating, whether responses are spread broadly, or whether a smaller dissatisfied group sits beneath a strong overall score.

In customer-experience analysis, the shape of the distribution is often as important as its center. A narrow cluster around four or five stars suggests consistency. A wide spread from one to five stars indicates variation. Two separate peaks may reveal polarization or multiple customer segments.

Distribution therefore helps distinguish a dependable product from one that performs exceptionally for many customers but fails severely for others.

Rating distribution restoring customer experience detail

Five Elements of a Rating Distribution

01

Five-Star Share

Shows the portion of customers reporting the strongest recorded outcome.

02

Four-Star Share

Identifies broadly positive experiences that may still contain minor friction.

03

Middle Ratings

Three-star reviews often reflect mixed outcomes or unmet expectations.

04

Lower-Rating Tail

One- and two-star reviews can reveal rare but severe failures.

05

Spread

Shows how tightly or widely customer responses are dispersed.

CONCENTRATION & DISPERSION

Narrow and Wide Distributions Mean Different Things

A narrow distribution shows that customers tend to report similar outcomes. A wide distribution shows that the experience varies substantially across customers.

Concentrated and dispersed customer rating distributions

Concentrated Distribution

5 Stars
70%
4 Stars
25%
3 Stars
5%
1–2 Stars
0%

Most customers report a similar positive experience. Operational risk appears limited and concentrated.

Dispersed Distribution

5 Stars
50%
4 Stars
15%
3 Stars
15%
1–2 Stars
20%

Many customers are satisfied, but a substantial group reports mixed or severe negative outcomes.

LOWER-RATING TAIL

Small Negative Tails Can Carry Large Operational Consequences

A lower-rating tail is the portion of the distribution represented by one-, two-, and sometimes three-star reviews. In a highly rated product, this group may be small, yet its practical importance can be substantial.

Lower ratings often contain the most detailed information about missing parts, delivery damage, installation problems, incorrect items, returns, performance gaps, or unresolved service issues. These failures may impose cost far beyond the number of affected reviews.

For large projects, a low one-star share can still represent significant operational exposure when multiplied across hundreds of rooms, fixtures, or locations.

Lower-rating tail in bathroom fixture reviews
Lower-Rating Pattern Possible Meaning Operational Concern
Small Three-Star Group Minor friction or unmet expectations Documentation, usability, or finish refinement
Small One-Star Group Rare but severe failure Product defect, missing item, delivery, return, or support breakdown
Growing Lower Tail Emerging instability or changing conditions New batch, product revision, shipping issue, or service decline
Stable Lower Tail Persistent minority failure pattern Structural issue requiring root-cause analysis
POSITIVE COMPOSITION

Five-Star and Four-Star Ratings Should Not Be Treated as Identical

Both star levels are positive, but they often represent different degrees of satisfaction. A five-star review commonly signals strong endorsement, while a four-star review may indicate approval with some remaining friction.

Five-star and four-star customer review composition
Five Stars

Strong Endorsement

Often associated with delight, confidence, recommendation, strong design approval, or successful completion.

Four Stars

Positive With Friction

May indicate satisfaction accompanied by installation effort, delivery delay, minor finish concerns, or unmet expectations.

A stable average can decline when customers shift from five stars to four stars even if severe dissatisfaction remains rare. This is why positive composition must be examined separately.

COMMON DISTRIBUTION SHAPES

Four Shapes That Require Different Interpretation

Common customer rating distribution shapes

Highly Concentrated

Ratings cluster tightly near four or five stars, suggesting a predictable experience.

Positively Skewed

Most ratings are high, with a smaller lower-rating tail.

Polarized

Responses cluster at both high and low levels, suggesting different user groups or conditions.

Broadly Dispersed

Ratings are spread across most star levels, indicating substantial variability.

FIXTURE-SPECIFIC DRIVERS

Why Bathroom Fixture Ratings Can Spread Widely

Bathroom products interact with building conditions, installation quality, customer expectations, and delivery processes. This creates more opportunities for otherwise similar products to receive different ratings.

Factors influencing bathroom fixture rating distribution

Building Conditions

Water pressure, pipe size, wall depth, electrical access, and drainage can affect outcome.

Installation Quality

Different installers may produce different results from the same product.

Expectation Gap

Marketing, imagery, or incomplete specifications can create unrealistic assumptions.

Fulfillment Accuracy

Missing, damaged, delayed, or incorrect components can produce severe ratings.

Support Quality

Fast technical resolution can improve recovery; poor support can deepen dissatisfaction.

Product Complexity

More outlets, controls, sensors, and concealed parts increase variation in the final experience.

SECTION CONCLUSIONS

Six Lessons From Rating Distribution

1. Concentration indicates predictability. Tight clustering suggests a more consistent experience.
2. Dispersion indicates variability. A broad spread shows that customers are not experiencing the product in the same way.
3. Five-star and four-star ratings carry different meaning. Both are positive, but they do not represent equal intensity.
4. Small negative tails can be important. Rare failures may create disproportionate cost and risk.
5. Distribution shape guides response. Refinement, segmentation, and failure investigation require different actions.
6. The average needs the distribution. One without the other is incomplete.
Key conclusions from rating distribution analysis
Transition to interpreting customer rating distributions
NEXT: SECTION 5.6.4

Why Review Distribution Changes Interpretation

The next section will show how different combinations of five-, four-, and lower-star ratings change the meaning of similar average scores and alter the conclusions a reader should draw.

Section 5.6.3 Methodology Note

The distribution examples in this section are illustrative. They are designed to explain concentration, dispersion, rating tails, and composition without representing a specific product or annual period.

Actual rating distributions from the proprietary review database will be analyzed in later parts of Section 5.6 using documented counts, periods, and evidence classifications.

SECTION 5.6.4 · INTERPRETING DISTRIBUTIONS

Why Review Distribution Changes Interpretation

A rating distribution does more than add detail to an average. It changes the conclusion a reader should draw. Similar averages can indicate dependable quality, mixed expectations, rare severe failures, inconsistent installation outcomes, or differences between customer groups.

How rating distribution changes customer review interpretation
INTERPRETATION PRINCIPLE

Distribution determines whether a rating reflects consistency, compromise, or risk.

The same headline score can support very different business and customer decisions.

SAME AVERAGE · DIFFERENT MEANING

Two 4.6 Ratings Can Tell Different Stories

The examples below use identical averages but different rating compositions.

PROFILE A

High Consistency

5 Stars
60%
4 Stars
40%
1–3 Stars
0%
4.6
Average Rating

Interpretation: broadly dependable performance with no visible lower-rating tail.

PROFILE B

Strong Average, Severe Tail

5 Stars
90%
4 Stars
0%
1 Star
10%
4.6
Average Rating

Interpretation: excellent outcomes for most customers, but a meaningful severe-failure group.

INTERPRETATION EFFECT

Distribution Changes the Meaning of Quality

A high average with a narrow distribution suggests reliable delivery of the intended experience. A high average with a severe negative tail suggests that the product or process works very well most of the time but fails significantly under certain conditions.

How distribution changes the interpretation of product quality

Consistency

Narrow distributions suggest customers receive similar outcomes across installations and use conditions.

Segmentation

Polarized ratings may indicate different products, customer groups, project types, or installation environments.

Operational Risk

A small one-star group may indicate low-frequency but high-impact failures.

Improvement Priority

The distribution determines whether the priority is refinement, prevention, recovery, or redesign.

PROJECT RISK

Distribution Matters More as Project Scale Increases

For an individual homeowner, a severe failure may affect one room. For a hotel, hospital, residential tower, or commercial facility, the same failure pattern can repeat across dozens or hundreds of fixtures.

A 5% severe-failure share may appear small in a product listing. Across 200 installed units, however, that same share could represent ten rooms requiring replacement parts, service visits, wall access, schedule disruption, or guest relocation.

Large-project buyers therefore need to examine distribution, not only the average. The lower-rating tail can be more relevant to operational planning than a small difference in the headline score.

Rating distribution and large bathroom project risk

Why a Small Tail Matters at Scale

Installed Units Severe-Failure Share Potentially Affected Units Possible Consequence
20 5% 1 Single service event or replacement
100 5% 5 Repeated labor, parts, and room disruption
200 5% 10 Noticeable operational and schedule exposure
500 5% 25 Material lifecycle and reputation risk

Illustrative arithmetic only. Actual project failure rates require verified installation and service records.

COMPOSITION SHIFTS

Not Every Average Decline Means More Dissatisfaction

An average can decline because five-star reviews shift to four stars even when one-, two-, and three-star shares remain stable. This is different from a decline caused by growth in severe negative ratings.

Different types of average rating decline

Positive Composition Shift

Five-star share declines while four-star share rises. Lower ratings remain rare.

Likely meaning: customers remain satisfied but report more minor friction or use a stricter rating standard.

Negative Composition Shift

One-, two-, or three-star shares rise and the lower tail becomes larger.

Likely meaning: more customers are experiencing meaningful dissatisfaction or severe failures.
INTERPRETATION MATRIX

How Distribution Should Change the Conclusion

Customer rating distribution interpretation matrix
Observed Pattern Primary Interpretation Question to Investigate Recommended Response
High Average, Narrow Spread Consistent positive outcome What creates repeatability? Protect and document the successful process
High Average, Severe Tail Strong majority with high-impact failures Which conditions produce severe outcomes? Investigate root causes and prevention
Moderate Average, Narrow Spread Consistent but underwhelming experience Which common friction limits satisfaction? Improve the broad customer journey
Moderate Average, Wide Spread Highly inconsistent or segmented experience Are products, users, or installations being mixed? Segment the data before deciding
BATHROOM FIXTURE APPLICATION

What Different Distributions May Reveal

Bathroom fixture examples of rating distribution interpretation

Mostly Five-Star

Strong design approval, successful installation, and good performance across most projects.

Mostly Four-Star

Customers are satisfied but repeatedly encounter minor installation, documentation, or delivery friction.

Five- and One-Star Split

The system performs exceptionally when conditions are correct but fails severely when components, pressure, installation, or service break down.

Broad Spread

Different product families, installation environments, or customer expectations may be combined in one summary.

SECTION CONCLUSIONS

Six Interpretation Rules

1. Similar averages do not imply similar risk. Lower-rating tails change the operational meaning.
2. A narrow spread supports consistency. A broad spread demands segmentation.
3. Large projects magnify rare failures. Small percentages can become material service events.
4. Not every decline is negative. A shift from five to four stars differs from growth in one-star reviews.
5. The response should match the pattern. Refinement, prevention, segmentation, and recovery solve different problems.
6. Distribution turns a score into a diagnosis. It shows what type of customer experience produced the average.
Key rules for interpreting customer rating distributions
Transition to the importance of time in customer ratings
NEXT: SECTION 5.6.5

Time Matters

The next section will explain why a rating must be evaluated across time, product changes, customer expectations, review volume, and historical stability.

Section 5.6.4 Methodology Note

Distribution profiles and project-scale examples in this section are illustrative. They demonstrate how rating composition changes interpretation and do not represent verified failure rates for a specific product or organization.

Actual conclusions should use documented review counts, rating distributions, product categories, time periods, and service records. Multiplying a review percentage by installed units is not a substitute for verified field-performance data.

SECTION 5.6.5 · LONGITUDINAL INTERPRETATION

Time Matters

A customer rating is recorded at a particular moment. Products change, factories change, packaging changes, installation practices change, customer expectations change, and review behavior changes. A single lifetime average can therefore combine experiences that no longer describe the same product or market conditions.

Time and historical change in bathroom fixture customer ratings
TIME PRINCIPLE

A stable average can hide major changes underneath.

Longitudinal analysis shows whether customer satisfaction is improving, declining, fluctuating, or merely changing composition.

WHY RATINGS MOVE

Ratings Change Even When the Product Name Does Not

A product can remain listed under the same name while its materials, packaging, internal components, supplier relationships, instructions, or manufacturing processes change. Customer expectations may also become stricter as competing products improve.

Distribution channels can create additional change. Shipping distance, carrier handling, warehouse procedures, seasonal demand, and stock availability may affect delivery and packaging outcomes even when the fixture itself remains unchanged.

For this reason, a historical average should be treated as a summary of many operating periods—not as evidence that the customer experience remained constant throughout them.

Bathroom fixture product changes over time

Eight Drivers of Rating Change

Product Revision

Changes to valves, cartridges, electronics, finishes, hardware, or packaging.

Manufacturing Variation

Factory, supplier, batch, tolerance, inspection, or material consistency.

Packaging & Logistics

Carrier handling, warehouse practices, protection, and order completeness.

Installation Practice

Trade experience, rough-in coordination, commissioning, and documentation use.

Customer Expectations

What once felt premium may later become expected as a standard feature.

Review Behavior

Prompt wording, platform design, incentives, and rating habits may shift.

Product Mix

The share of faucets, showers, touchless systems, and complex products may change.

Service Process

Response speed, technical support, parts availability, and return handling.

LIFETIME VS PERIOD VIEW

One Lifetime Average Can Hide Several Different Eras

A lifetime score blends early, middle, and recent customer experiences. Period averages show whether those experiences remain consistent.

Lifetime average versus period average in bathroom fixture reviews
PERIOD 1
4.9
Strong opening period
PERIOD 2
4.3
Operational decline
PERIOD 3
4.5
Partial recovery
LIFETIME
4.6
Blended result

The lifetime average is mathematically correct, but it conceals the decline and recovery pattern.

Importance of recent customer reviews for bathroom fixtures
RECENCY

Recent Reviews May Better Describe the Current Product

Older reviews remain valuable for historical stability and long-term pattern analysis. Recent reviews may be more relevant to the current product version, current packaging, present service processes, and current customer expectations.

Neither period should automatically replace the other. A recent three-month improvement may be too short to establish stability. A strong ten-year lifetime score may be too broad to describe a product that changed substantially last year.

The most responsible approach is to report both current and historical views, while clearly defining the dates and review counts behind each.

Time View Primary Strength Primary Limitation Best Use
Recent 90 Days Current product and service conditions May be volatile or seasonal Early warning and current-state monitoring
Current Year Broader current performance Incomplete-year distortion Year-to-date operations
Three-Year Period Reduces short-term noise Can blend product revisions Medium-term trend analysis
Lifetime Long historical perspective May not reflect current conditions Brand or product-history context
MOVING AVERAGES

Moving Averages Reduce Short-Term Noise

A moving average combines several adjacent periods to smooth sharp temporary changes. It can make the underlying direction easier to see, but it also reacts more slowly to sudden improvements or problems.

Moving average trend analysis for customer ratings

Benefit

Reduces the influence of one unusually strong or weak period and clarifies broader movement.

Tradeoff

Delays recognition of sudden changes because older periods remain inside the calculation.

Correct Use

Display the moving average beside the original annual or monthly values—not as a replacement for them.

INCOMPLETE PERIODS

Partial Years Should Never Be Presented as Completed Years

A year-to-date result may contain only part of the normal seasonal cycle. Product launches, construction schedules, holiday demand, shipping conditions, or review campaigns can be concentrated in specific months.

Even a large year-to-date sample remains incomplete. High volume improves numerical stability, but it does not restore the missing months or guarantee that the observed product mix will continue.

Partial periods should therefore be labeled clearly, compared with equivalent prior-year periods where possible, and kept separate from completed-year rankings.

Incomplete year customer rating analysis
TIME-BASED INTERPRETATION

How Trend Shape Changes the Conclusion

Time-based customer rating interpretation matrix
Trend Pattern Possible Meaning Required Check Interpretation Status
Stable High Rating Consistent customer satisfaction Confirm stable product and sample composition Strong
Gradual Improvement Better product, service, or process performance Identify changes and confirm sample continuity Promising
Sudden Decline Operational issue, product change, or review-process shift Check distribution, topics, dates, batches, and channels Investigate
High Volatility Inconsistent experience or small samples Review sample size, product mix, and period definition Unstable
SECTION CONCLUSIONS

Seven Rules for Time-Based Rating Analysis

1. Ratings belong to a time period. They should not be separated from their dates.
2. Product names can remain stable while products change. Revisions and suppliers matter.
3. Lifetime averages hide eras. Period averages reveal movement.
4. Recent reviews may better describe current conditions. Older reviews remain important for stability.
5. Moving averages clarify direction. They should be shown beside original values.
6. Incomplete years are provisional. High volume does not make a partial year complete.
7. Trend changes require explanation. Rating movement alone does not reveal the cause.
Rules for time-based customer rating analysis
Transition to sample size and rating confidence
NEXT: SECTION 5.6.6

Sample Size Changes Confidence

The next section will explain why the same rating carries different evidentiary strength when it is based on 25, 250, 2,500, or 25,000 reviews.

Section 5.6.5 Methodology Note

Examples in this section are illustrative and explain longitudinal interpretation, recency, moving averages, and incomplete periods.

Time-based changes in average ratings do not independently establish product improvement or decline. Product mix, review volume, solicitation, customer composition, record processing, seasonality, and operational conditions must also be evaluated.

SECTION 5.6.5 · LONGITUDINAL INTERPRETATION

Time Matters

A customer rating is recorded at a particular moment. Products change, factories change, packaging changes, installation practices change, customer expectations change, and review behavior changes. A single lifetime average can therefore combine experiences that no longer describe the same product or market conditions.

Time and historical change in bathroom fixture customer ratings
TIME PRINCIPLE

A stable average can hide major changes underneath.

Longitudinal analysis shows whether customer satisfaction is improving, declining, fluctuating, or merely changing composition.

WHY RATINGS MOVE

Ratings Change Even When the Product Name Does Not

A product can remain listed under the same name while its materials, packaging, internal components, supplier relationships, instructions, or manufacturing processes change. Customer expectations may also become stricter as competing products improve.

Distribution channels can create additional change. Shipping distance, carrier handling, warehouse procedures, seasonal demand, and stock availability may affect delivery and packaging outcomes even when the fixture itself remains unchanged.

For this reason, a historical average should be treated as a summary of many operating periods—not as evidence that the customer experience remained constant throughout them.

Bathroom fixture product changes over time

Eight Drivers of Rating Change

Product Revision

Changes to valves, cartridges, electronics, finishes, hardware, or packaging.

Manufacturing Variation

Factory, supplier, batch, tolerance, inspection, or material consistency.

Packaging & Logistics

Carrier handling, warehouse practices, protection, and order completeness.

Installation Practice

Trade experience, rough-in coordination, commissioning, and documentation use.

Customer Expectations

What once felt premium may later become expected as a standard feature.

Review Behavior

Prompt wording, platform design, incentives, and rating habits may shift.

Product Mix

The share of faucets, showers, touchless systems, and complex products may change.

Service Process

Response speed, technical support, parts availability, and return handling.

LIFETIME VS PERIOD VIEW

One Lifetime Average Can Hide Several Different Eras

A lifetime score blends early, middle, and recent customer experiences. Period averages show whether those experiences remain consistent.

Lifetime average versus period average in bathroom fixture reviews
PERIOD 1
4.9
Strong opening period
PERIOD 2
4.3
Operational decline
PERIOD 3
4.5
Partial recovery
LIFETIME
4.6
Blended result

The lifetime average is mathematically correct, but it conceals the decline and recovery pattern.

Importance of recent customer reviews for bathroom fixtures
RECENCY

Recent Reviews May Better Describe the Current Product

Older reviews remain valuable for historical stability and long-term pattern analysis. Recent reviews may be more relevant to the current product version, current packaging, present service processes, and current customer expectations.

Neither period should automatically replace the other. A recent three-month improvement may be too short to establish stability. A strong ten-year lifetime score may be too broad to describe a product that changed substantially last year.

The most responsible approach is to report both current and historical views, while clearly defining the dates and review counts behind each.

Time View Primary Strength Primary Limitation Best Use
Recent 90 Days Current product and service conditions May be volatile or seasonal Early warning and current-state monitoring
Current Year Broader current performance Incomplete-year distortion Year-to-date operations
Three-Year Period Reduces short-term noise Can blend product revisions Medium-term trend analysis
Lifetime Long historical perspective May not reflect current conditions Brand or product-history context
MOVING AVERAGES

Moving Averages Reduce Short-Term Noise

A moving average combines several adjacent periods to smooth sharp temporary changes. It can make the underlying direction easier to see, but it also reacts more slowly to sudden improvements or problems.

Moving average trend analysis for customer ratings

Benefit

Reduces the influence of one unusually strong or weak period and clarifies broader movement.

Tradeoff

Delays recognition of sudden changes because older periods remain inside the calculation.

Correct Use

Display the moving average beside the original annual or monthly values—not as a replacement for them.

INCOMPLETE PERIODS

Partial Years Should Never Be Presented as Completed Years

A year-to-date result may contain only part of the normal seasonal cycle. Product launches, construction schedules, holiday demand, shipping conditions, or review campaigns can be concentrated in specific months.

Even a large year-to-date sample remains incomplete. High volume improves numerical stability, but it does not restore the missing months or guarantee that the observed product mix will continue.

Partial periods should therefore be labeled clearly, compared with equivalent prior-year periods where possible, and kept separate from completed-year rankings.

Incomplete year customer rating analysis
TIME-BASED INTERPRETATION

How Trend Shape Changes the Conclusion

Time-based customer rating interpretation matrix
Trend Pattern Possible Meaning Required Check Interpretation Status
Stable High Rating Consistent customer satisfaction Confirm stable product and sample composition Strong
Gradual Improvement Better product, service, or process performance Identify changes and confirm sample continuity Promising
Sudden Decline Operational issue, product change, or review-process shift Check distribution, topics, dates, batches, and channels Investigate
High Volatility Inconsistent experience or small samples Review sample size, product mix, and period definition Unstable
SECTION CONCLUSIONS

Seven Rules for Time-Based Rating Analysis

1. Ratings belong to a time period. They should not be separated from their dates.
2. Product names can remain stable while products change. Revisions and suppliers matter.
3. Lifetime averages hide eras. Period averages reveal movement.
4. Recent reviews may better describe current conditions. Older reviews remain important for stability.
5. Moving averages clarify direction. They should be shown beside original values.
6. Incomplete years are provisional. High volume does not make a partial year complete.
7. Trend changes require explanation. Rating movement alone does not reveal the cause.
Rules for time-based customer rating analysis
Transition to sample size and rating confidence
NEXT: SECTION 5.6.6

Sample Size Changes Confidence

The next section will explain why the same rating carries different evidentiary strength when it is based on 25, 250, 2,500, or 25,000 reviews.

Section 5.6.5 Methodology Note

Examples in this section are illustrative and explain longitudinal interpretation, recency, moving averages, and incomplete periods.

Time-based changes in average ratings do not independently establish product improvement or decline. Product mix, review volume, solicitation, customer composition, record processing, seasonality, and operational conditions must also be evaluated.

SECTION 5.6.5 · LONGITUDINAL INTERPRETATION

Time Matters

A customer rating is recorded at a particular moment. Products change, factories change, packaging changes, installation practices change, customer expectations change, and review behavior changes. A single lifetime average can therefore combine experiences that no longer describe the same product or market conditions.

Time and historical change in bathroom fixture customer ratings
TIME PRINCIPLE

A stable average can hide major changes underneath.

Longitudinal analysis shows whether customer satisfaction is improving, declining, fluctuating, or merely changing composition.

WHY RATINGS MOVE

Ratings Change Even When the Product Name Does Not

A product can remain listed under the same name while its materials, packaging, internal components, supplier relationships, instructions, or manufacturing processes change. Customer expectations may also become stricter as competing products improve.

Distribution channels can create additional change. Shipping distance, carrier handling, warehouse procedures, seasonal demand, and stock availability may affect delivery and packaging outcomes even when the fixture itself remains unchanged.

For this reason, a historical average should be treated as a summary of many operating periods—not as evidence that the customer experience remained constant throughout them.

Bathroom fixture product changes over time

Eight Drivers of Rating Change

Product Revision

Changes to valves, cartridges, electronics, finishes, hardware, or packaging.

Manufacturing Variation

Factory, supplier, batch, tolerance, inspection, or material consistency.

Packaging & Logistics

Carrier handling, warehouse practices, protection, and order completeness.

Installation Practice

Trade experience, rough-in coordination, commissioning, and documentation use.

Customer Expectations

What once felt premium may later become expected as a standard feature.

Review Behavior

Prompt wording, platform design, incentives, and rating habits may shift.

Product Mix

The share of faucets, showers, touchless systems, and complex products may change.

Service Process

Response speed, technical support, parts availability, and return handling.

LIFETIME VS PERIOD VIEW

One Lifetime Average Can Hide Several Different Eras

A lifetime score blends early, middle, and recent customer experiences. Period averages show whether those experiences remain consistent.

Lifetime average versus period average in bathroom fixture reviews
PERIOD 1
4.9
Strong opening period
PERIOD 2
4.3
Operational decline
PERIOD 3
4.5
Partial recovery
LIFETIME
4.6
Blended result

The lifetime average is mathematically correct, but it conceals the decline and recovery pattern.

Importance of recent customer reviews for bathroom fixtures
RECENCY

Recent Reviews May Better Describe the Current Product

Older reviews remain valuable for historical stability and long-term pattern analysis. Recent reviews may be more relevant to the current product version, current packaging, present service processes, and current customer expectations.

Neither period should automatically replace the other. A recent three-month improvement may be too short to establish stability. A strong ten-year lifetime score may be too broad to describe a product that changed substantially last year.

The most responsible approach is to report both current and historical views, while clearly defining the dates and review counts behind each.

Time View Primary Strength Primary Limitation Best Use
Recent 90 Days Current product and service conditions May be volatile or seasonal Early warning and current-state monitoring
Current Year Broader current performance Incomplete-year distortion Year-to-date operations
Three-Year Period Reduces short-term noise Can blend product revisions Medium-term trend analysis
Lifetime Long historical perspective May not reflect current conditions Brand or product-history context
MOVING AVERAGES

Moving Averages Reduce Short-Term Noise

A moving average combines several adjacent periods to smooth sharp temporary changes. It can make the underlying direction easier to see, but it also reacts more slowly to sudden improvements or problems.

Moving average trend analysis for customer ratings

Benefit

Reduces the influence of one unusually strong or weak period and clarifies broader movement.

Tradeoff

Delays recognition of sudden changes because older periods remain inside the calculation.

Correct Use

Display the moving average beside the original annual or monthly values—not as a replacement for them.

INCOMPLETE PERIODS

Partial Years Should Never Be Presented as Completed Years

A year-to-date result may contain only part of the normal seasonal cycle. Product launches, construction schedules, holiday demand, shipping conditions, or review campaigns can be concentrated in specific months.

Even a large year-to-date sample remains incomplete. High volume improves numerical stability, but it does not restore the missing months or guarantee that the observed product mix will continue.

Partial periods should therefore be labeled clearly, compared with equivalent prior-year periods where possible, and kept separate from completed-year rankings.

Incomplete year customer rating analysis
TIME-BASED INTERPRETATION

How Trend Shape Changes the Conclusion

Time-based customer rating interpretation matrix
Trend Pattern Possible Meaning Required Check Interpretation Status
Stable High Rating Consistent customer satisfaction Confirm stable product and sample composition Strong
Gradual Improvement Better product, service, or process performance Identify changes and confirm sample continuity Promising
Sudden Decline Operational issue, product change, or review-process shift Check distribution, topics, dates, batches, and channels Investigate
High Volatility Inconsistent experience or small samples Review sample size, product mix, and period definition Unstable
SECTION CONCLUSIONS

Seven Rules for Time-Based Rating Analysis

1. Ratings belong to a time period. They should not be separated from their dates.
2. Product names can remain stable while products change. Revisions and suppliers matter.
3. Lifetime averages hide eras. Period averages reveal movement.
4. Recent reviews may better describe current conditions. Older reviews remain important for stability.
5. Moving averages clarify direction. They should be shown beside original values.
6. Incomplete years are provisional. High volume does not make a partial year complete.
7. Trend changes require explanation. Rating movement alone does not reveal the cause.
Rules for time-based customer rating analysis
Transition to sample size and rating confidence
NEXT: SECTION 5.6.6

Sample Size Changes Confidence

The next section will explain why the same rating carries different evidentiary strength when it is based on 25, 250, 2,500, or 25,000 reviews.

Section 5.6.5 Methodology Note

Examples in this section are illustrative and explain longitudinal interpretation, recency, moving averages, and incomplete periods.

Time-based changes in average ratings do not independently establish product improvement or decline. Product mix, review volume, solicitation, customer composition, record processing, seasonality, and operational conditions must also be evaluated.

SECTION 5.6.6 · EVIDENCE STRENGTH

Sample Size Changes Confidence

The same average rating carries different evidentiary strength when it is based on 25, 250, 2,500, or 25,000 reviews. Larger samples generally reduce random instability and make descriptive estimates more precise, but volume alone cannot correct biased collection, duplicated records, mixed products, incomplete periods, or unrepresentative customer participation.

Sample size and confidence in bathroom fixture customer review analysis
SAMPLE-SIZE PRINCIPLE

More reviews usually improve precision—not automatic truth.

Sample size should be evaluated together with representativeness, independence, time coverage, product mix, and record quality.

WHY VOLUME MATTERS

Small Samples React Strongly to Individual Reviews

When only a few reviews are available, one new rating can noticeably change the average. In a group of 25 reviews, a single one-star or five-star record represents 4% of the entire sample. In a group of 2,500 reviews, one record represents only 0.04%.

This does not make small samples useless. They may provide an early signal, identify an urgent failure, or describe a specialized product with naturally limited volume. The correct interpretation is simply more cautious because the estimate remains sensitive to each additional observation.

As sample size grows, the average and rating proportions generally become less reactive to isolated reviews. The result is usually greater numerical stability, provided the additional records are valid and relevant.

Small and large review samples in bathroom fixture research

How One Review Affects Different Sample Sizes

25

Reviews

4.00%

Each review's share of the sample.

250

Reviews

0.40%

Each review's share of the sample.

2,500

Reviews

0.04%

Each review's share of the sample.

25,000

Reviews

0.004%

Each review's share of the sample.

PRECISION

Larger Samples Usually Produce Narrower Uncertainty Ranges

NIST explains that confidence intervals provide a range of plausible values for a population parameter and that, all else equal, interval width becomes narrower as sample size increases through the square-root-of-sample-size relationship.

Confidence intervals and sample size in customer review research

Illustrative 95% Margin of Error for a 50% Proportion

N = 25
±19.6
percentage points
N = 250
±6.2
percentage points
N = 2,500
±2.0
percentage points
N = 25,000
±0.6
percentage points

Illustrative simple-random-sample calculation at the maximum-uncertainty proportion of 50%. Customer reviews are usually self-selected rather than probability samples, so these values must not be presented as formal margins of error for an e-commerce review database.

Large customer review sample and representativeness limitations
REPRESENTATIVENESS

A Large Biased Sample Can Still Mislead

Review databases usually contain responses from customers who chose to submit a rating. This is different from a probability sample in which members of a defined population have known selection chances. A large review count therefore improves descriptive stability within the observed database but does not automatically make the reviewers representative of every purchaser or market participant.

Participation may be influenced by satisfaction intensity, review requests, incentives, product type, purchase channel, language, technical confidence, or whether the customer completed installation. Some purchasers never submit a review, and their experiences remain unobserved.

The correct claim is therefore that a large database supports strong analysis of the recorded reviews. It does not, without additional sampling evidence, prove the exact opinions of all customers in the wider market.

What Sample Size Cannot Fix

Self-Selection

Reviewers may differ systematically from customers who remain silent.

Duplicate Records

More rows do not create more evidence when the same experience is repeated.

Mixed Populations

Different products, channels, or time periods can hide important subgroups.

Measurement Bias

Prompts, wording, rating scales, and editorial changes can influence responses.

Missing Denominator

Review counts alone do not reveal what share of all purchasers responded.

RARE EVENTS

Larger Samples Are Better at Revealing Low-Frequency Patterns

Rare issues may not appear at all in a small sample even when they exist. Larger databases provide more opportunities to observe missing components, unusual installation failures, isolated finish problems, or severe service breakdowns.

Rare customer complaint patterns and large review samples
True Underlying Frequency Expected Cases in 25 Expected Cases in 250 Expected Cases in 2,500 Expected Cases in 25,000
10% 2.5 25 250 2,500
1% 0.25 2.5 25 250
0.1% 0.025 0.25 2.5 25

Expected counts are illustrative arithmetic. Actual observed cases vary, and review databases do not necessarily represent all installed products.

DIMINISHING RETURNS

Ten Times More Reviews Does Not Mean Ten Times More Precision

Statistical precision commonly improves with the square root of the sample size. To reduce a standard error by roughly half, the sample generally must become about four times larger, assuming the sampling process and variability remain comparable.

The greatest practical gain often occurs when moving from a very small sample to a moderate one. Increasing from 25 to 250 reviews changes the evidence far more dramatically than increasing from 25,000 to 25,225.

Once sample volume is strong, improving data quality, segmentation, time control, classification, and record validation may add more analytical value than simply collecting additional unstructured reviews.

Diminishing statistical returns from increasing customer review sample size
EVIDENCE CLASSIFICATION

Sample-Size Confidence Framework

The categories below are practical reporting bands for this study—not universal statistical standards.

Customer review evidence confidence framework by sample size
Eligible Records Study Classification Appropriate Use Required Caution
Fewer than 30 Exploratory Illustrative examples and early signals Highly sensitive to individual records
30–99 Limited Directional observations Avoid precise ranking or broad generalization
100–499 Moderate Descriptive comparison with controls Check subgroup and product-mix effects
500–999 Strong Robust descriptive period analysis Still dependent on collection quality
1,000 or more Very Strong Volume Detailed distribution and topic analysis Volume does not prove representativeness or causality
SECTION CONCLUSIONS

Eight Rules for Sample-Size Interpretation

1. Small samples are sensitive. Individual reviews can materially change the result.
2. Larger samples usually improve precision. Random instability generally declines as volume grows.
3. Volume is not representativeness. Self-selected reviews cannot automatically describe every purchaser.
4. Confidence intervals require assumptions. Formal margins of error should not be attached casually to review databases.
5. Rare patterns need volume. Larger datasets are more capable of revealing low-frequency events.
6. Precision has diminishing returns. Data quality becomes increasingly important after volume is strong.
7. Every claim needs its own denominator. Annual, topic, product, and lower-rating findings may use different eligible samples.
8. Confidence is multidimensional. Sample size, quality, coverage, independence, and relevance all matter.
Rules for sample size and confidence in customer review analysis
Transition to average rating and rating stability
NEXT: SECTION 5.6.7

Average Rating vs. Rating Stability

The next section will explain why two products with similar long-term averages can have very different year-to-year consistency, volatility, and operational reliability.

Section 5.6.6 Source & Methodology Notes

NIST/SEMATECH Engineering Statistics Handbook, Confidence Intervals: https://www.itl.nist.gov/div898/handbook/prc/section1/prc14.htm

NIST/SEMATECH Engineering Statistics Handbook, Confidence Limits for the Mean: https://www.itl.nist.gov/div898/handbook/eda/section3/eda352.htm

U.S. Census Bureau, Sample Size Definitions and Sampling Error: https://www.census.gov/programs-surveys/acs/methodology/sample-size-and-data-quality/sample-size-definitions.html

The sample-size classifications in this section are proprietary reporting bands created for this study. They are not universal statistical thresholds. The margin-of-error examples assume a simple random sample and are included only to demonstrate the mathematical relationship between sample size and precision; they do not apply directly to self-selected customer-review data.

SECTION 5.6.7 · LONG-TERM CONSISTENCY

Average Rating vs. Rating Stability

Average rating measures the overall level of recorded satisfaction. Rating stability measures how consistently that level is maintained across time. Two products can share the same long-term average while producing very different year-to-year customer experiences.

Average rating compared with rating stability in bathroom fixture reviews
STABILITY PRINCIPLE

A high average is stronger when it remains high consistently.

Long-term consistency reduces uncertainty and reveals whether strong customer outcomes are repeatable rather than temporary.

SAME LONG-TERM AVERAGE

Similar Averages Can Hide Different Histories

The examples below are hypothetical and both produce a five-year average of 4.6 stars.

PRODUCT A

Stable Performance

Year 1
4.6
Year 2
4.7
Year 3
4.5
Year 4
4.6
Year 5
4.6
4.6
Five-Year Average

Interpretation: strong, repeatable performance with limited annual movement.

PRODUCT B

Volatile Performance

Year 1
5.0
Year 2
4.2
Year 3
5.0
Year 4
4.0
Year 5
4.8
4.6
Five-Year Average

Interpretation: identical overall average, but much greater uncertainty and operational variability.

DEFINING STABILITY

Rating Stability Is the Consistency of Performance Across Time

Stability is not the same as a high score. A product can remain consistently average, consistently excellent, or consistently poor. Stability describes repeatability; the average describes level.

Rating stability and repeatability in customer satisfaction

Average Level

Shows whether recorded satisfaction is generally high, moderate, or low.

Annual Spread

Shows how far yearly ratings move around the long-term average.

Direction

Shows whether performance is stable, improving, declining, or reversing.

Persistence

Shows whether changes last long enough to represent a true shift.

OPERATIONAL TRUST

Stability Matters Because Buyers Need Predictability

A homeowner may accept some uncertainty when purchasing one fixture. A hotel, hospital, contractor, developer, or facility team purchasing at scale needs greater confidence that the same product will perform consistently across time and installations.

Stable ratings can suggest that product quality, packaging, documentation, installation support, and service processes remain reasonably repeatable. High volatility may signal changes in product mix, fulfillment, manufacturing, installation conditions, or review collection.

Stability does not prove field reliability, but it helps identify whether recorded customer experience is predictable enough to support larger purchasing decisions.

Rating stability and operational trust in bathroom fixture projects
Average Level Stability Level Interpretation Business Meaning
High High Strong and repeatable satisfaction Most desirable profile for long-term confidence
High Low Strong overall result with inconsistent periods Investigate volatility before relying on the average
Moderate High Predictable but underwhelming performance Broad improvement is required
Moderate Low Inconsistent and average performance Highest uncertainty and weakest confidence
VOLATILITY DRIVERS

Rating Volatility Can Come From Product or Process Changes

Year-to-year movement does not identify the cause by itself. Volatility must be connected to product, operational, and data-collection changes.

Drivers of rating volatility in bathroom fixture customer reviews

Product Revision

Changes in cartridges, sensors, valves, finishes, electronics, or included components.

Manufacturing Shift

New suppliers, factories, batches, quality controls, or material substitutions.

Fulfillment Change

Packaging, carrier performance, warehouse handling, or inventory constraints.

Review Process

Different prompts, collection channels, incentives, imports, or editing practices.

Product Mix

Changes in the share of simple versus complex fixtures can shift annual averages.

Customer Expectations

A product may remain unchanged while the market's standard of excellence rises.

Measuring long-term customer rating stability
MEASUREMENT FRAMEWORK

Stability Requires More Than One Statistic

A complete stability assessment should examine the spread of annual averages, the size of year-to-year changes, the direction of the trend, the persistence of improvements or declines, and the sample size supporting each period.

Standard deviation can summarize how much annual ratings vary around their average. Maximum annual movement can identify abrupt changes. Trend direction can reveal drift. Confidence grading can prevent small-sample years from receiving equal weight.

These elements will later support the report's proprietary Rating Stability Index™, which combines multiple stability dimensions into a transparent interpretive score.

Measure What It Shows Primary Limitation
Annual Standard Deviation Typical spread of annual ratings around the long-term mean Can be distorted by low-volume years
Maximum Annual Change Largest year-to-year movement Focuses on one extreme event
Trend Slope Overall direction of ratings across time May hide reversals or nonlinear movement
Distribution Stability Whether five-, four-, and lower-rating shares remain consistent Requires detailed annual counts
Evidence Weight How strongly each year should influence the conclusion Requires transparent weighting rules
IMPORTANT DISTINCTION

Stability Is Not Always Excellence

A consistently moderate rating may indicate predictable mediocrity rather than superior performance. Stability becomes valuable only when evaluated together with satisfaction level.

Difference between rating stability and stagnant performance
4.8 ± 0.05

Stable Excellence

High satisfaction combined with very limited annual variation.

4.0 ± 0.05

Stable but Limited

Predictable experience, but the level suggests recurring friction.

4.8 ± 0.40

High but Unstable

Strong overall average with major annual swings and reduced predictability.

SECTION CONCLUSIONS

Eight Rules for Rating Stability

1. Average measures level. Stability measures repeatability.
2. Similar averages can hide different histories. Annual paths matter.
3. High and stable is stronger than high and volatile. Predictability adds value.
4. Stability matters more at project scale. Large buyers need repeatable outcomes.
5. Volatility requires explanation. Product, process, and data changes must be checked.
6. One statistic is not enough. Spread, direction, persistence, and evidence weight all matter.
7. Stability is not automatically excellence. A stable low score remains weak.
8. Stability supports trust when the average is already strong. The two measures should be read together.
Rules for interpreting rating stability
Transition to what the customer satisfaction study measures
NEXT: SECTION 5.6.8

What This Study Measures

The next section will define the report's analytical scope, including rating trends, distributions, stability, customer topics, evidence quality, and the limits of the conclusions.

Section 5.6.7 Methodology Note

The annual examples in this section are hypothetical and are designed to distinguish average level from year-to-year stability.

The Rating Stability Index™ referenced here will be introduced later as a proprietary analytical framework. Its formula, weighting, limitations, and evidence requirements must be published transparently before any score is used for comparison.

SECTION 5.6.8 · ANALYTICAL SCOPE

What This Study Measures

This study examines recorded customer-review behavior across time. It measures rating level, rating composition, annual stability, lower-rating concentration, topic frequency, customer-language change, and evidence strength. It does not claim to measure the entire bathroom-fixture market, verified product failure rates, total sales performance, or the opinions of customers who did not submit reviews.

Analytical scope of the bathroom fixture customer review study
SCOPE PRINCIPLE

Every conclusion must match the data actually observed.

Strong research defines both what the evidence supports and what remains outside the study.

DATA UNIVERSE

The Study Uses More Than One Analytical Denominator

The complete dated rating analysis includes 14,367 records with valid review dates and numerical star ratings. This denominator supports annual volume, average rating, five-star share, four-or-five-star share, and lower-rating composition.

The customer-language analysis uses 11,381 review texts that passed the documented text-eligibility controls. This smaller denominator supports topic classification, complaint signals, vocabulary change, and customer-priority analysis.

Some specialized analyses use still smaller subsets, such as reviews containing return language, missing-item language, or ratings of three stars or lower. Each section must state its applicable denominator so readers do not confuse one population with another.

Multiple analytical denominators in customer review research

Core Analytical Populations

14,367

Dated Rating Records

Used for annual volume, averages, star distribution, and historical rating trends.

11,381

Eligible Review Texts

Used for topic frequency, vocabulary, complaint signals, and customer-priority analysis.

419

Three Stars or Lower

Used as a diagnostic lower-rating subset within the screened text sample.

Variable

Topic-Specific Samples

Counts vary according to the complaint, topic, phrase family, period, or product signal being analyzed.

RATING MEASURES

The Study Measures Level, Composition, and Change

No single rating statistic is treated as sufficient. The study combines several complementary measures to describe both the level and structure of customer response.

Customer rating measures used in the bathroom fixture study

Average Rating

Arithmetic mean of the recorded numerical star ratings.

Five-Star Share

Percentage of records reporting the highest star level.

Four-or-Five-Star Share

Broad positive-experience concentration.

Lower-Rating Share

Percentage of records at three stars or below.

Annual Movement

Year-to-year change in averages and rating composition.

Historical Stability

Consistency of the recorded customer outcome across time.

Customer language and topic measures in bathroom fixture reviews
LANGUAGE MEASURES

Review Text Explains What Customers Are Discussing

Topic analysis identifies whether eligible review texts mention design, installation, reliability, materials, finish, delivery, support, water performance, value, returns, missing items, or other documented subjects.

Vocabulary analysis tracks specific word and phrase families such as touchless, sensor, thermostatic, digital, smart, maintenance, brushed gold, matte black, installation, and customer support.

These measures describe what appears in the recorded language. They do not independently establish what every customer cared about, what caused the rating, or what proportion of all buyers experienced the topic.

Measure What It Describes What It Does Not Prove
Topic Frequency Share of eligible reviews containing a classified subject Total market importance or causal impact
Topic Rating Association Average rating among reviews mentioning a subject That the topic directly caused the rating
Vocabulary Frequency Visibility of selected terms across time Sales growth, adoption rate, or universal preference
Complaint Signal Presence of return, missing-item, delivery, or other friction language Verified incident rate or legal responsibility
PROPRIETARY METRICS

Original Metrics Will Be Kept Separate From Standard Statistics

Later sections introduce proprietary composite measures designed for this report. These metrics will be clearly labeled as original analytical frameworks rather than established statistical standards.

Proprietary rating and satisfaction metrics in the study

Rating Stability Index™

Composite view of annual variation, movement, persistence, and evidence strength.

Satisfaction Consistency Index™

Long-term consistency of positive rating composition and low severe-failure concentration.

Positive Experience Ratio

Share of ratings classified as four or five stars.

Historical Rating Drift

Direction and magnitude of change across defined periods.

Annual Rating Volatility

Year-to-year movement in average and rating composition.

Review Distribution Quality Index

Composite interpretation of concentration, positive share, lower-tail size, and sample support.

EVIDENCE QUALITY

The Study Measures Confidence as Well as Findings

A result based on 1,500 eligible reviews should not be treated the same as a result based on 15. Evidence grading therefore considers record count, period completeness, text quality, classification specificity, and the possibility of product-mix or process effects.

High volume may support detailed descriptive analysis while still requiring caution about representativeness. A small but highly specific signal may be operationally important even when its evidence grade remains moderate.

The purpose of confidence grading is not to dismiss weaker findings. It is to show readers how strongly each conclusion should be trusted and how narrowly it should be stated.

Evidence quality and confidence grading in customer review research

Evidence Quality Dimensions

Sample Volume

How many eligible records support the finding.

Period Completeness

Whether the time interval is complete, partial, or historically sparse.

Text Eligibility

Whether review text contains enough usable language for classification.

Classification Specificity

How directly the phrase rules identify the intended topic.

Process Stability

Whether review collection, editing, and import practices appear comparable.

LIMITS

What This Study Does Not Measure

Transparency requires stating the limits as clearly as the findings.

Limits of the bathroom fixture customer review study

Total Market Share

The database does not measure all bathroom-fixture purchases or brands.

Verified Failure Rate

Review complaints are not equivalent to engineering incident or warranty-rate data.

All-Customer Opinion

Customers who did not review are not directly observed.

Causal Responsibility

A review cannot by itself establish whether a problem originated with product, delivery, installation, or use.

Field Reliability

Long-term engineering reliability requires installed-base, maintenance, and service records.

Independent Market Sampling

The review database is observational and self-selected rather than a probability sample of the market.

RESPONSIBLE REPORTING

Match the Claim to the Evidence

Responsible claim language for customer review research
Evidence Type Responsible Claim Claim to Avoid
Review Frequency “This topic appears in 42% of eligible review texts.” “42% of all customers experienced this issue.”
Rating Association “Reviews mentioning returns average lower ratings.” “Returns caused the rating decline.”
Vocabulary Trend “Sensor language became more frequent in later records.” “Market demand for sensors increased by the same amount.”
Annual Rating Change “The recorded average changed from one year to the next.” “Product quality definitely improved or declined.”
SECTION CONCLUSIONS

Eight Rules for Analytical Scope

Use the Correct Denominator

Rating, text, complaint, and topic analyses may use different eligible samples.

Measure More Than the Mean

Average, composition, lower tails, time, and stability should be evaluated together.

Separate Language From Incidence

A topic appearing in a review is not the same as a verified event rate.

Label Original Metrics

Proprietary indices must not be presented as established statistical standards.

Grade the Evidence

Sample size, time completeness, and classification quality affect confidence.

State the Limits

The study does not measure the full market, verified failures, or silent customers.

Avoid Causal Overreach

Associations and trends should not be converted into unsupported causal claims.

Match the Claim

The language of each conclusion should reflect the strength and scope of the data.

Transition to independent statistical research foundations
NEXT: SECTION 5.6.9

Independent Research Foundations

The next section will connect the study's methodology with established principles from recognized statistical organizations while clearly separating standard concepts from original report metrics.

Section 5.6.8 Methodology Note

This section defines the analytical scope and denominators used throughout the report. Counts reflect the documented database and eligibility controls applied during the study.

Proprietary metrics named in this section are conceptual previews. Their formulas, weighting, interpretation bands, and limitations must be published in the relevant later sections before any score is presented as a formal result.

SECTION 5.6.9 · METHODOLOGICAL FOUNDATIONS

Independent Research Foundations

The study is grounded in established principles of statistical description, uncertainty, sampling, transparent methodology, responsible interpretation, and ethical reporting. Recognized statistical organizations provide the methodological foundation; any composite indices created specifically for this report remain clearly identified as proprietary analytical tools.

Independent statistical foundations for bathroom fixture review research
RESEARCH PRINCIPLE

Credibility comes from transparent methods—not from impressive numbers alone.

Data sources, assumptions, eligibility rules, uncertainty, limitations, and original metrics must all be explained clearly.

FOUNDATION OVERVIEW

Established Principles Guide the Analysis

NIST's Engineering Statistics Handbook provides established explanations of descriptive statistics, variation, confidence intervals, and the assumptions required for statistical inference. These principles support the report's treatment of averages, annual variability, sample size, and uncertainty.

The American Statistical Association's Ethical Guidelines emphasize valid and appropriate methods, transparent assumptions, communication of data limitations, resistance to selective interpretation, and clear distinction between exploratory and confirmatory work.

U.S. Census Bureau guidance helps clarify the difference between probability samples and observational review databases. Formal sampling error and margins of error depend on the sample design; they should not be attached automatically to self-selected customer reviews.

Established statistical principles guiding customer review research

Core Independent Authorities

NIST

Statistical methods, confidence intervals, variation, engineering analysis, and underlying assumptions.

NIST Handbook

American Statistical Association

Ethical analysis, valid methods, transparency, accountability, limitations, and reproducibility.

ASA Guidelines

U.S. Census Bureau

Sampling error, sample design, uncertainty, data quality, and the interpretation of estimates.

Sample Guidance

Royal Statistical Society

Statistical literacy, responsible public interpretation, and communication of quantitative evidence.

RSS Resources
DESCRIPTIVE VS. INFERENTIAL

The Study Is Primarily Descriptive

Descriptive analysis summarizes the observed records. Inferential analysis uses a sample design and assumptions to draw conclusions about a broader population. This report primarily describes the review database and avoids presenting self-selected reviews as a probability sample of all bathroom-fixture customers.

Descriptive and inferential statistics in customer review analysis

Descriptive Analysis

Reports what is observed inside the eligible review records.

Average rating
Rating distribution
Topic frequency
Annual review volume
Vocabulary change

Inferential Analysis

Estimates a broader population using a defined sampling design and assumptions.

Formal margins of error
Population confidence intervals
Probability-based generalization
Hypothesis tests
Population parameters
UNCERTAINTY

Confidence Intervals Depend on the Data-Generation Process

NIST defines a confidence interval as a method for producing a range that, under repeated sampling and the stated assumptions, contains the true population parameter at a specified long-run rate. The interpretation belongs to the interval-producing method—not to a guarantee about one particular interval.

The familiar interval formulas generally assume a probability-based or otherwise justified sampling process. Customer reviews are commonly self-selected, making formal population confidence intervals inappropriate unless the participation and selection mechanism can be defended.

This report may use interval examples to explain statistical concepts, but it will not present conventional margins of error as though the review database were a simple random sample.

Confidence interval assumptions in customer review research
Principle Established Meaning Application in This Study
Repeated-Sampling Interpretation The method captures the parameter at the stated long-run rate Explained conceptually, not converted into unsupported review margins
Sample-Size Effect Intervals generally narrow as sample size increases Used to explain precision, with self-selection cautions
Design Dependence Variance estimation depends on how the sample was selected Review data are not treated as a simple random sample
Assumption Disclosure Interpretation requires transparent assumptions Methods and limitations are published beside findings
ETHICAL PRACTICE

Responsible Analysis Requires More Than Correct Arithmetic

The ASA's guidelines emphasize appropriate methods, transparent assumptions, honest interpretation, disclosure of limitations and data-processing steps, resistance to selective reporting, protection of data subjects, and reproducibility where possible.

Ethical statistical practice in customer review reporting

Valid Methods

Use methods appropriate to the question and the available data.

Transparent Assumptions

State eligibility rules, exclusions, transformations, and uncertainty.

No Selective Interpretation

Report findings that complicate the preferred narrative as well as those that support it.

Limitations Disclosed

Explain self-selection, missing data, product mix, and process changes.

Reproducible Rules

Document formulas, phrase families, thresholds, and scoring logic.

Privacy Protected

Publish aggregate findings without exposing unnecessary personal information.

Sampling and nonsampling error in review database analysis
ERROR SOURCES

Uncertainty Is Broader Than Sampling Error

Census Bureau guidance distinguishes sampling error from nonsampling error. Sampling error arises because only part of a population is observed under a probability-sampling design. Nonsampling error can arise through measurement, response, processing, classification, coverage, or data-handling problems.

In a customer-review database, the larger concern is often nonsampling and selection uncertainty: who chooses to review, how the question is asked, how text is edited, whether records are duplicated, which products are represented, and how dates or categories are assigned.

Increasing the number of reviews may reduce random instability inside the database, but it cannot automatically correct systematic selection or processing problems.

Error or Bias Source Possible Effect Study Control
Self-Selection Reviewers may differ from silent purchasers Limit claims to the observed review population
Measurement Change Prompt or rating behavior may change over time Treat abrupt period shifts cautiously
Processing Error Incorrect dates, categories, or duplicate rows Validate, deduplicate, and preserve audit rules
Product-Mix Change Annual ratings may shift without product-quality change Segment where reliable product classification exists
Text Classification Keyword rules may miss context or create false matches Publish phrase rules and validate samples manually
METHOD SEPARATION

Standard Statistics and Original Metrics Serve Different Roles

Standard statistical measures should remain identifiable and reproducible. Proprietary indices may summarize several dimensions, but they must never obscure the underlying data or be presented as universally accepted standards.

Standard statistical measures versus proprietary analytical metrics

Established Measures

Arithmetic mean
Median
Proportion
Standard deviation
Trend slope
Confidence interval under stated assumptions

Proprietary Frameworks

Rating Stability Index™
Satisfaction Consistency Index™
Review Distribution Quality Index
Evidence Confidence Grade
Composite customer-friction scores

Every proprietary metric should publish its formula, inputs, weights, scale, interpretation bands, exclusions, sensitivity, and limitations. Readers should always be able to inspect the underlying standard measures.

REPRODUCIBILITY

What Another Analyst Should Be Able to Verify

Reproducibility requirements for customer review research

Record Counts

The number of records entering and leaving each eligibility stage.

Date Rules

How original dates, retrospective records, incomplete years, and periods are handled.

Text Rules

Minimum text quality, exclusions, phrase families, and classification logic.

Rating Formulas

How averages, proportions, volatility, and annual comparisons are calculated.

Metric Weights

Every component and weight inside a proprietary index.

Sensitivity Tests

How conclusions change when years, rules, or classifications are adjusted.

SECTION CONCLUSIONS

Ten Rules for Independent Research Credibility

Define the Data

State exactly which records support each conclusion.

Separate Description

Do not present observed reviews as a probability sample of the entire market.

Disclose Assumptions

Every statistical interpretation depends on assumptions that readers should see.

Avoid False Precision

Do not attach formal margins of error to self-selected data without a defensible design.

Report Adverse Findings

Credibility requires publishing evidence that complicates the desired narrative.

Separate Error Types

Sampling, selection, measurement, and processing uncertainty are not interchangeable.

Label Original Metrics

Proprietary indices must remain distinct from established statistical measures.

Publish the Formula

Composite scores need transparent inputs, weights, and interpretation bands.

Protect Privacy

Aggregate findings should avoid unnecessary disclosure of personal information.

Enable Verification

Another analyst should be able to reproduce the principal calculations.

Transition to thirty years of rating evolution
NEXT: SECTION 5.6.10

Transition to Thirty Years of Rating Evolution

The final section of Part 1 will summarize the methodological foundation and prepare the reader for Part 2, where the report applies these principles to the actual 1995–2026 rating record.

Section 5.6.9 Independent Source Notes

NIST/SEMATECH Engineering Statistics Handbook: https://www.nist.gov/programs-projects/nistsematech-engineering-statistics-handbook

NIST, What Are Confidence Intervals?: https://www.itl.nist.gov/div898/handbook/prc/section1/prc14.htm

NIST, Confidence Limits for the Mean: https://www.itl.nist.gov/div898/handbook/eda/section3/eda352.htm

American Statistical Association, Ethical Guidelines for Statistical Practice: https://www.amstat.org/your-career/ethical-guidelines-for-statistical-practice

U.S. Census Bureau, Sample Size Definitions: https://www.census.gov/programs-surveys/acs/methodology/sample-size-and-data-quality/sample-size-definitions.html

U.S. Census Bureau, Sampling Error: https://www.census.gov/programs-surveys/sipp/methodology/sampling-error.html

Royal Statistical Society: https://rss.org.uk/

SECTION 5.6.10 · PART 1 CONCLUSION

Transition to Thirty Years of Rating Evolution

Part 1 established the analytical foundation required to interpret customer ratings responsibly. The report can now move from statistical principles into the actual 1995–2026 review record, where annual averages, star distributions, sample strength, volatility, and long-term consistency will be examined together.

Transition from rating methodology to thirty years of bathroom fixture review analysis
FROM METHOD TO EVIDENCE

The next stage applies the framework to the real historical record.

Actual annual ratings will be evaluated by level, composition, stability, sample strength, and historical context.

PART 1 SUMMARY

Ten Principles Now Guide the Historical Analysis

The opening sections showed why an average rating is useful but incomplete. They demonstrated that identical averages can hide different customer experiences, that rating distributions reveal consistency and severe lower-rating tails, and that time changes the meaning of a lifetime score.

They also established that sample size changes numerical stability, that large observational databases are not automatically representative samples, and that formal statistical claims must match the way the data were generated.

These principles prevent the historical review record from being reduced to one promotional number. The next part will preserve the detail necessary to understand how customer satisfaction actually changed.

Summary of customer rating analysis principles
01

Average Is a Starting Point

The mean summarizes ratings but does not explain their structure.

02

Distribution Changes Meaning

Five-, four-, and lower-star shares determine the customer-experience pattern.

03

Consistency Is Separate

High satisfaction and stable satisfaction are related but distinct.

04

Time Must Be Visible

Lifetime scores can conceal declines, recoveries, and changing rating composition.

05

Sample Size Changes Strength

Large annual samples support stronger descriptive conclusions.

06

Volume Is Not Representation

Self-selected reviews cannot automatically describe every purchaser.

07

Claims Need Denominators

Every percentage must identify the records eligible for that calculation.

08

Association Is Not Causation

Review topics can accompany ratings without directly causing them.

09

Original Metrics Need Disclosure

Composite indices must publish formulas, weights, and limits.

10

Confidence Must Be Graded

Not every year or subgroup carries equal evidentiary weight.

PART 2 SCOPE

Thirty Years of Rating Evolution

Part 2 will move from illustrative examples to the actual historical review database.

Thirty years of bathroom fixture rating evolution analysis

Annual Average Rating

How the recorded mean changed from 1995 through 2026.

Five-Star Evolution

Whether strongest-endorsement share increased, declined, or shifted into four-star ratings.

Four-Star Evolution

How broadly positive but less-than-perfect ratings changed over time.

Lower-Rating Tail

Changes in one-, two-, and three-star concentration.

Annual Volatility

Magnitude and direction of year-to-year movement.

Evidence Confidence

Which historical periods support strong conclusions and which remain exploratory.

Data quality gates for historical customer rating analysis
QUALITY GATES

Historical Findings Will Pass Through Defined Controls

Before an annual result is interpreted, the study checks whether the year contains enough records, whether the period is complete, whether the rating distribution is internally coherent, and whether abrupt changes may reflect review-process or product-mix effects.

Early years with very small samples will remain visible for historical continuity, but they will not receive the same analytical weight as modern years containing hundreds or thousands of records.

The 2026 year-to-date period will remain separate from completed calendar years because its volume is high but its time coverage and rating composition are incomplete.

Quality Gate Question Possible Action
Sample Strength Are enough records available for a stable annual estimate? Grade as exploratory, limited, moderate, strong, or very strong
Period Completeness Does the period contain the full calendar year? Label as completed or year-to-date
Distribution Coherence Does the average align with the star composition? Investigate anomalies or processing errors
Historical Comparability Are review collection and product mix reasonably comparable? Limit or qualify cross-period interpretation
Sensitivity Does the conclusion change when weak years or special periods are removed? Report robust and provisional findings separately
HOW TO READ PART 2

Historical Charts Will Be Paired With Interpretation

The next part will not present charts without context. Each visual will explain what changed, how much evidence supports the change, what alternative explanations remain possible, and what the finding does not prove.

How to read historical bathroom fixture rating charts

Observe the Level

How high or low is the recorded annual rating?

Inspect the Composition

Is movement caused by five-star, four-star, or lower-rating change?

Check the Sample

How many records support the result?

Review the Direction

Is the change temporary, persistent, improving, or declining?

Consider Alternatives

Could product mix, process change, or incomplete time coverage explain the result?

Read the Confidence Grade

How strongly should the conclusion be stated?

PART 1 EXECUTIVE CONCLUSION

A Rating Becomes Meaningful Only When Its Structure Is Visible

Average ratings remain useful because they provide a compact summary of recorded customer sentiment. Their value increases substantially when they are paired with distribution, time, sample strength, topic context, and evidence confidence.

The complete analysis must ask not only whether a rating is high, but how it was produced, how consistently it was maintained, how many records support it, and whether the underlying customer language reveals operational friction.

Part 2 will now apply this framework to the thirty-year historical record and identify the periods of greatest satisfaction, strongest stability, largest composition change, and highest analytical confidence.

Executive conclusion for customer rating methodology
Opening of Part 2 thirty years of rating evolution
SECTION 5.6 · PART 2

Thirty Years of Rating Evolution

The next part examines the actual 1995–2026 rating record, including annual averages, star-level composition, volatility, historical phases, and confidence by year.

14,367 Ratings
32 Calendar Years
1995–2026

Section 5.6.10 Methodology Note

This section concludes the conceptual foundation of Part 1 and introduces the empirical rating analysis in Part 2. No new statistical results are introduced here.

The historical analyses that follow should preserve the annual record count, period status, rating distribution, and evidence grade beside every major conclusion.

SECTION 5.6.11 · PART 2 HISTORICAL OVERVIEW

Thirty Years of Rating Evolution

The historical record spans 1995 through 2026 and contains 14,367 dated numerical ratings. The early years provide continuity but limited statistical strength, while the modern period supports substantially stronger analysis of annual averages, five-star concentration, four-star migration, lower-rating behavior, and rating stability.

Thirty years of bathroom fixture customer rating evolution
HISTORICAL RECORD

Long-term satisfaction remained high, but its composition changed.

The most important historical movement is not simply whether ratings rose or fell, but whether customers shifted between five stars, four stars, and the lower-rating tail.

14,367

Dated Ratings

Records supporting the longitudinal star-rating analysis.

32

Calendar Years

Historical coverage from 1995 through 2026.

4.853

Highest Complete Year

Recorded in 2023.

4.561

Lowest Since 2015

Recorded in the complete 2018 year.

4.602

2026 YTD

Provisional partial-year average.

HISTORICAL ERAS

The Record Should Be Read in Three Evidence Eras

The database does not have equal annual depth across its full history. Dividing the record by evidence strength prevents sparse early years from being interpreted like high-volume modern years.

Three historical evidence eras in customer rating analysis
1995–2013

Exploratory Era

Only 83 eligible review texts span this entire period. The years preserve historical continuity but should not support precise annual ranking or strong trend claims.

2014–2019

Developing Evidence Era

Review volume becomes sufficient for period-level analysis, while individual annual conclusions still require attention to sample size and composition.

2020–2026

High-Volume Era

Modern years contain substantially stronger volume and support detailed distribution, language, and stability analysis. The 2026 period remains incomplete.

MODERN PERFORMANCE RANGE

Modern Complete-Year Ratings Remained Within a Relatively Narrow Band

Among complete years from 2015 onward, the highest recorded annual average was 4.853 in 2023, while the lowest was 4.561 in 2018. The difference between those two complete-year results is 0.292 stars.

On a five-star scale, this is a meaningful but not extreme spread. It suggests that overall satisfaction remained high while still moving enough to justify analysis of annual composition and underlying topics.

The range alone does not reveal whether changes came from more severe dissatisfaction or from migration between five-star and four-star reviews. That distinction becomes essential in the sections that follow.

Modern annual customer rating range
COMPLETE-YEAR MODERN RANGE
4.561
2018 Low
4.853
2023 High

A 0.292-star spread is large enough to investigate, but too small to interpret responsibly without examining sample size and star-level composition.

2026 YEAR-TO-DATE

The 2026 Average Declined Without a Large Low-Rating Increase

The 2026 year-to-date average is 4.602, yet 99.1% of the dated records remain four or five stars. The observed decline is therefore driven primarily by movement from five-star to four-star ratings rather than a major expansion of one-, two-, or three-star reviews.

2026 year-to-date rating composition analysis
4.602

Average Rating

Lower than the 2023 complete-year high, but still strongly positive.

99.1%

Four or Five Stars

Severe dissatisfaction remains rare in the partial-year record.

Provisional

Interpretation Status

The year is incomplete and should not be ranked directly against completed years.

Historical customer rating overview conclusions
PRELIMINARY INTERPRETATION

The Historical Story Is About Composition as Much as Level

The broad historical record does not suggest a collapse in customer satisfaction. Even the lower modern complete-year average remains above 4.5 stars, and the partial 2026 period remains overwhelmingly concentrated in four- and five-star ratings.

The more useful question is whether customers are expressing the same intensity of satisfaction. A shift from five stars to four stars can reduce the average while preserving a very high positive-experience ratio.

The next historical sections will therefore separate five-star concentration, four-star migration, and the lower-rating tail rather than treating all average movement as one phenomenon.

OVERVIEW MATRIX

Historical Rating Interpretation by Era

Historical rating interpretation matrix
Period Evidence Strength Primary Use Main Caution
1995–2013 Exploratory Historical continuity and broad context Sparse annual records and unstable percentages
2014–2019 Developing to Strong Period trends and selected annual comparisons Changing volume and product composition
2020–2025 Very Strong Volume Detailed annual distribution and stability analysis Review-process and product-mix effects still require control
2026 YTD High Volume, Incomplete Current-state monitoring and provisional interpretation Missing months and unusual language composition
HISTORICAL OVERVIEW FINDINGS

Seven Findings From the Historical Overview

The Record Is Long

Thirty-two calendar years provide unusual historical depth.

Evidence Is Uneven

Early years cannot support the same precision as modern years.

Modern Ratings Stayed High

The lowest complete year since 2015 remained above 4.5 stars.

2023 Was the Peak

It recorded the highest complete-year average at 4.853.

2018 Was the Modern Low

Its complete-year average was 4.561.

2026 Remains Positive

Despite a lower average, 99.1% of ratings remain four or five stars.

Composition Is the Key

Future sections must separate five-star movement from true lower-rating growth.

Transition to annual average rating timeline
NEXT: SECTION 5.6.12

Annual Average Rating Timeline

The next section will examine the annual rating path, identify the strongest and weakest complete years, and separate meaningful movement from changes driven by sparse samples or incomplete periods.

Section 5.6.11 Methodology Note

This section presents a historical overview using previously validated database totals and annual summary findings. It does not reproduce every annual value.

The 2026 result is year-to-date and remains provisional. Early historical years are retained for continuity but should not be interpreted with the same confidence as modern high-volume years.

SECTION 5.6.12 · PART 1

Annual Average Rating Timeline

The annual timeline tracks how recorded customer ratings changed from 1995 through 2026. Its purpose is not simply to identify the highest or lowest year, but to show the direction, magnitude, persistence, sample strength, and rating composition behind every historical movement.

Annual average bathroom fixture customer rating timeline from 1995 through 2026
TIMELINE PRINCIPLE

Every annual rating must be read beside its sample size and composition.

A movement based on thousands of reviews carries different evidentiary weight from the same movement based on only a handful of records.

WHY THE TIMELINE MATTERS

Annual Results Reveal Movement That Lifetime Averages Conceal

A lifetime average compresses decades of customer experience into one number. The annual timeline restores the sequence of events and shows whether changes were gradual, sudden, temporary, persistent, or concentrated in years with weak evidence.

It also helps distinguish stable satisfaction from volatility. Two datasets may have the same long-term average, yet one may remain consistent while the other moves sharply between strong and weak years.

For this study, annual averages will always be interpreted together with review volume, five-star share, four-star share, lower-rating concentration, and period completeness.

Annual customer rating movement compared with lifetime average

How to Read the Annual Timeline

01

Read the Rating

Identify the annual average and its position within the historical range.

02

Check the Volume

Determine how many dated ratings support the annual result.

03

Inspect Composition

Separate five-star, four-star, and lower-rating movement.

04

Compare Adjacent Years

Measure the size and direction of year-over-year change.

05

Check Persistence

Determine whether the change continues, reverses, or disappears.

06

Read the Confidence Grade

Interpret strong and exploratory years differently.

ANNUAL CONFIDENCE BANDS

Every Year Receives an Evidence Classification

Annual volume is not the only quality measure, but it is the first control. Years with very small samples remain visible while receiving lower interpretive weight.

Annual evidence confidence bands for customer review timeline
Annual Records Confidence Band Permitted Interpretation Primary Caution
Fewer than 30 Exploratory Historical continuity and anecdotal direction Individual ratings can change the result materially
30–99 Limited Directional annual interpretation Avoid precise annual ranking
100–499 Moderate Descriptive annual comparison Product mix and process effects remain important
500–999 Strong Robust annual distribution analysis Still observational and self-selected
1,000 or more Very Strong Volume Detailed annual composition and topic analysis Volume does not prove market representativeness
VERIFIED ANCHOR YEARS

Three Years Already Define the Modern Range

Verified anchor years in annual rating timeline
2018
4.561

Modern Complete-Year Low

The lowest completed annual average recorded since 2015.

2023
4.853

Highest Complete Year

The strongest verified complete-year average in the modern record.

2026 YTD
4.602

Current Provisional Period

A partial-year result with 99.1% of ratings remaining four or five stars.

Transition to complete annual rating timeline
SECTION 5.6.12 · PART 2

Complete 1995–2026 Timeline

The next HTML section will display the full year-by-year timeline with verified average ratings, annual record counts, evidence grades, and year-over-year movement.

Section 5.6.12 Part 1 Methodology Note

This introduction defines how the annual timeline will be structured and interpreted. It uses only previously validated anchor-year findings and does not invent unverified annual values.

The complete timeline should be populated directly from the analyzed database so every year displays a verified average, record count, year-over-year change, composition, and confidence grade.

SECTION 5.6.12 · PART 1

Annual Average Rating Timeline

The annual timeline tracks how recorded customer ratings changed from 1995 through 2026. Its purpose is not simply to identify the highest or lowest year, but to show the direction, magnitude, persistence, sample strength, and rating composition behind every historical movement.

Annual average bathroom fixture customer rating timeline from 1995 through 2026
TIMELINE PRINCIPLE

Every annual rating must be read beside its sample size and composition.

A movement based on thousands of reviews carries different evidentiary weight from the same movement based on only a handful of records.

WHY THE TIMELINE MATTERS

Annual Results Reveal Movement That Lifetime Averages Conceal

A lifetime average compresses decades of customer experience into one number. The annual timeline restores the sequence of events and shows whether changes were gradual, sudden, temporary, persistent, or concentrated in years with weak evidence.

It also helps distinguish stable satisfaction from volatility. Two datasets may have the same long-term average, yet one may remain consistent while the other moves sharply between strong and weak years.

For this study, annual averages will always be interpreted together with review volume, five-star share, four-star share, lower-rating concentration, and period completeness.

Annual customer rating movement compared with lifetime average

How to Read the Annual Timeline

01

Read the Rating

Identify the annual average and its position within the historical range.

02

Check the Volume

Determine how many dated ratings support the annual result.

03

Inspect Composition

Separate five-star, four-star, and lower-rating movement.

04

Compare Adjacent Years

Measure the size and direction of year-over-year change.

05

Check Persistence

Determine whether the change continues, reverses, or disappears.

06

Read the Confidence Grade

Interpret strong and exploratory years differently.

ANNUAL CONFIDENCE BANDS

Every Year Receives an Evidence Classification

Annual volume is not the only quality measure, but it is the first control. Years with very small samples remain visible while receiving lower interpretive weight.

Annual evidence confidence bands for customer review timeline
Annual RecordsConfidence BandPermitted InterpretationPrimary Caution
Fewer than 30ExploratoryHistorical continuity and anecdotal directionIndividual ratings can change the result materially
30–99LimitedDirectional annual interpretationAvoid precise annual ranking
100–499ModerateDescriptive annual comparisonProduct mix and process effects remain important
500–999StrongRobust annual distribution analysisStill observational and self-selected
1,000 or moreVery Strong VolumeDetailed annual composition and topic analysisVolume does not prove market representativeness
VERIFIED ANCHOR YEARS

Three Years Already Define the Modern Range

Verified anchor years in annual rating timeline
2018
4.561

Modern Complete-Year Low

The lowest completed annual average recorded since 2015.

2023
4.853

Highest Complete Year

The strongest verified complete-year average in the modern record.

2026 YTD
4.602

Current Provisional Period

A partial-year result with 99.1% of ratings remaining four or five stars.

Transition to complete annual rating timeline
SECTION 5.6.12 · PART 2

Complete 1995–2026 Timeline

The next HTML section will display the full year-by-year timeline with verified average ratings, annual record counts, evidence grades, and year-over-year movement.

Section 5.6.12 Part 1 Methodology Note

This introduction defines how the annual timeline will be structured and interpreted. It uses only previously validated anchor-year findings and does not invent unverified annual values.

The complete timeline should be populated directly from the analyzed database so every year displays a verified average, record count, year-over-year change, composition, and confidence grade.

SECTION 5.6.12 • PART 3.1

Interpreting Thirty Years of Rating Movement

A historical rating timeline should not be interpreted as a sequence of isolated annual averages. Instead, each year represents one observation within a continuously evolving customer experience system. Meaningful interpretation depends on understanding the relationship between annual averages, review volume, rating distribution, customer expectations, and long-term behavioral trends rather than examining individual years independently.

LONGITUDINAL INTERPRETATION

One Year Never Tells the Entire Story

Customer ratings naturally fluctuate over time. New product introductions, changes in customer expectations, purchasing behavior, shipping conditions, installation complexity, seasonal demand, and review participation all contribute to annual variation. For this reason, interpreting a single year's average without considering the surrounding historical context frequently produces misleading conclusions.

Longitudinal analysis focuses on patterns instead of isolated observations. Rather than asking whether one year appears higher or lower than another, it examines whether the direction of movement persists across multiple years, whether the magnitude exceeds expected variation, and whether the underlying rating composition changes simultaneously.

Throughout this report, annual averages are interpreted together with review volume, five-star concentration, four-star migration, lower-rating frequency, and evidence strength. These complementary indicators provide a more reliable representation of customer satisfaction than the average rating alone.

HOW TO INTERPRET MOVEMENT

Five Questions Every Historical Rating Change Should Answer

Was the change sustained?

Temporary fluctuations often disappear the following year, while sustained movement usually indicates a meaningful long-term shift.

How large was the change?

Small annual differences frequently occur naturally and should not automatically be interpreted as improving or declining customer satisfaction.

How strong was the evidence?

Changes supported by thousands of reviews deserve greater confidence than identical movements observed in very small annual samples.

Which ratings actually moved?

A lower annual average may result from fewer five-star ratings rather than increased customer dissatisfaction.

Does the trend continue?

Historical interpretation becomes substantially stronger when similar movement continues across multiple consecutive years.

32

Years Evaluated

Historical interpretation spans more than three decades of documented customer ratings.

14,367

Verified Ratings

Every trend discussed throughout this section originates from the documented rating database rather than sampled estimates.

Beyond Averages

Multi-Dimensional Analysis

Annual averages are interpreted alongside rating distribution, review volume, and historical continuity to provide a more complete picture of customer behavior.

NEXT SECTION

Stable Years vs. Transitional Years

The next section classifies the entire historical timeline into periods of stability, gradual transition, and statistically meaningful change to distinguish normal annual variation from genuine shifts in customer sentiment.

SECTION 5.6.12 • PART 3.2

Stable Years vs. Transitional Years

Customer satisfaction rarely changes at a constant rate. Long historical datasets generally alternate between periods of stability, gradual transition, and occasional turning points. Recognizing these phases provides a more accurate understanding of long-term customer experience than comparing annual averages in isolation.

HISTORICAL STABILITY

Most Years Are Remarkably Stable

Across the thirty-two-year record, annual averages generally remain within a relatively narrow range. Even the difference between the strongest complete year (4.853) and the weakest complete modern year (4.561) is less than one-third of a star, indicating consistently high overall customer satisfaction rather than large swings in sentiment.

This stability becomes more meaningful during the modern high-volume period, where annual averages are supported by hundreds or thousands of reviews. Small year-to-year movements are expected in any long-running review system and should not automatically be interpreted as evidence of improving or declining product quality.

Instead, the most informative signals emerge when several consecutive years move in the same direction or when changes in average ratings coincide with shifts in five-star concentration, lower-rating frequency, or review participation.

THREE HISTORICAL STATES

Every Year Can Be Classified Into One of Three Behavioral States

Stable Period

Annual averages fluctuate only modestly while review volume, rating distribution, and customer sentiment remain broadly consistent. These periods indicate mature and predictable customer experience.

Transitional Period

Several consecutive years begin moving in the same direction. These intervals often reflect evolving customer expectations, product portfolio changes, operational adjustments, or shifts in review participation.

Turning Point

A year in which the historical direction changes noticeably. Turning points require confirmation through subsequent years before being interpreted as long-term structural shifts.

Historical Classification Matrix

Behavior Typical Pattern Interpretation
Stable Small annual movement with consistent rating composition Represents long-term customer satisfaction consistency.
Transitional Several consecutive years moving in one direction Suggests gradual structural change requiring continued observation.
Turning Point Abrupt directional reversal Should be confirmed by later years before drawing long-term conclusions.
NEXT SECTION

Identifying Historical Turning Points

The following section identifies the specific years where the long-term trajectory changes and examines whether those changes persist or return to the historical trend.

SECTION 5.6.12 • PART 3.3

Identifying Historical Turning Points

Not every annual increase or decrease represents a meaningful historical event. A turning point occurs only when customer ratings change direction and that new direction persists long enough to distinguish it from normal year-to-year variation. This section separates genuine structural shifts from ordinary statistical fluctuation.

TURNING POINT PRINCIPLES

Most Annual Changes Are Not Turning Points

Customer review systems naturally produce modest annual variation. Small movements often reflect ordinary randomness, changes in participation, product mix, or review timing rather than a genuine change in customer satisfaction. Declaring every increase or decrease to be a turning point exaggerates normal statistical behavior.

A credible turning point requires more than a single year's movement. It should be supported by adequate review volume, accompanied by a meaningful change in rating composition, and followed by evidence that the new direction continues beyond the initial observation.

For this report, turning points are interpreted using multiple indicators simultaneously, including annual average rating, review volume, five-star concentration, lower-rating frequency, and subsequent historical performance.

TURNING POINT CRITERIA

Five Conditions Used to Confirm a Historical Turning Point

Directional Change

The annual trend reverses or begins moving consistently in a new direction.

Adequate Evidence

The observed movement is supported by sufficient review volume rather than a sparse sample.

Composition Shift

Changes in five-star or lower-rating shares reinforce the movement seen in the average.

Persistence

The new direction continues into subsequent years rather than immediately reversing.

Historical Context

The movement is interpreted within the broader thirty-two-year historical record rather than as an isolated event.

Likely Turning Points in the Current Dataset

Year Observed Event Evidence Status Interpretation
2015 Modern high-volume era begins Strong Annual comparisons become substantially more reliable.
2018 Lowest modern complete-year average Strong Represents a notable decline but remains above 4.5 stars.
2023 Highest complete-year average Very Strong Represents the strongest modern customer satisfaction level.
2026 YTD Five-star concentration declines Incomplete Year Requires confirmation after the full calendar year before being considered a true historical turning point.
NEXT SECTION

Five-Star Migration vs. Lower-Rating Growth

The next analysis determines whether lower annual averages resulted from fewer exceptional experiences or from a genuine increase in dissatisfied customers.

SECTION 5.6.12 • PART 3.4

Five-Star Migration vs. Lower-Rating Growth

One of the most common mistakes in customer-review analysis is assuming that a lower average rating automatically indicates more dissatisfied customers. Longitudinal review data frequently demonstrates a different pattern: the overall average declines because fewer customers assign five-star ratings while the proportion of genuinely negative reviews remains largely unchanged. Distinguishing between these two mechanisms is essential for interpreting customer sentiment accurately.

THE KEY DISTINCTION

Not Every Declining Average Represents More Dissatisfied Customers

A reduction in the annual average can occur through two very different pathways. The first is an increase in one-, two-, or three-star reviews, indicating that more customers experienced significant dissatisfaction. The second is a shift from five-star ratings toward four-star ratings while negative reviews remain comparatively rare. Although both situations reduce the numerical average, they describe fundamentally different customer experiences.

The historical dataset demonstrates why rating composition should always accompany average ratings. Looking only at the mean score can conceal whether customer sentiment is becoming genuinely negative or simply less enthusiastic.

This distinction is particularly important when evaluating mature brands with consistently high customer satisfaction, where relatively small changes in five-star concentration may influence the average more than changes in lower-rating frequency.

TWO DIFFERENT CUSTOMER STORIES

Average Ratings Alone Cannot Distinguish These Outcomes

Scenario A

Lower-Rating Growth

Average ratings decline because one-, two-, and three-star reviews become more common. This pattern generally indicates increasing customer dissatisfaction and often warrants investigation into recurring operational or product-related issues.

Scenario B

Five-Star Migration

Average ratings decline primarily because more customers select four stars instead of five while genuinely negative reviews remain uncommon. This pattern reflects moderation in enthusiasm rather than widespread dissatisfaction.

Evidence From the Current Dataset

Indicator Observation Interpretation
2023 Average 4.853 Highest complete-year average.
2026 YTD Average 4.602 Lower average than 2023.
2026 Low Ratings 0.9% Negative ratings remain uncommon.
Primary Driver Reduced five-star concentration Current evidence is more consistent with five-star migration than widespread dissatisfaction.
KEY INTERPRETATION

The Average Declined More Than Customer Satisfaction

Based on the current historical record, the observed reduction in the annual average appears to be driven primarily by a decrease in five-star ratings rather than a substantial increase in lower ratings. This suggests a moderation in the intensity of positive experiences rather than a broad shift toward negative customer sentiment. Because 2026 is still an incomplete year, this interpretation should be confirmed when the full annual dataset becomes available.

NEXT SECTION

Long-Term Customer Satisfaction Stability

The following section measures the long-term stability of customer satisfaction across three decades and evaluates whether the historical record demonstrates consistency, gradual evolution, or sustained volatility.

RESEARCH APPENDIX A

Rating Distribution Analytics

This appendix locks down the annual star distribution, weighted-average verification, satisfaction intensity, polarization, historical stability, and the exact 2023-to-2026 YTD rating decomposition using 14,367 dated review records.

Rating distribution analytics research appendix

The average declined because top-rating intensity fell—not because low ratings grew.

Five-star share fell 27.4 points, four-star share rose 29.0 points, and the combined one-to-three-star share declined 1.6 points.

14,367

Dated Ratings

4.708

Overall Average

96.0%

Positive Ratio

-0.250

2023→2026 Change

Exact Star Distribution Decomposition

The full comparison uses the actual counts at every star level.

Rating2023 Count2023 Share2026 YTD Count2026 YTD ShareChange
5★1,48588.7%1,07161.3%-27.4 pts
4★1488.8%66137.8%+29.0 pts
3★321.9%150.9%-1.1 pts
2★50.3%00.0%-0.3 pts
1★50.3%10.1%-0.2 pts

Five-Star Effect

−0.274 stars

The 27.4-point loss in five-star share is the sole downward driver in the baseline decomposition.

Low-Rating Offset

+0.024 stars

Fewer one-, two-, and three-star ratings partially offset the five-star decline.

Exact Net Change

−0.250 stars

The decomposition exactly reconstructs the difference between 4.853 and 4.602.

Research Limitation

The database is observational and self-selected. These findings rigorously describe the recorded reviews, but they do not independently establish market-wide customer incidence, engineering failure rates, or causal responsibility. The 2026 period is incomplete through June 26, 2026.

SECTION 5.6.12 · PART 3.5

Long-Term Customer Satisfaction Stability

Long-term stability measures how consistently customer ratings remain within a relatively narrow range across multiple completed years. The verified modern period shows high overall satisfaction, moderate annual movement, and stronger stability after 2020 than during the earlier 2015–2019 transition period.

Long-term customer satisfaction stability across bathroom fixture reviews
STABILITY PRINCIPLE

Strong satisfaction becomes more credible when it remains repeatable.

The modern complete-year record averages 4.717 stars, with annual values varying by approximately 0.084 stars around that mean.

Verified Modern Stability Profile

4.717

Annual Mean

Unweighted average of completed years 2015–2025.

4.721

Weighted Average

Weighted by 12,134 dated ratings.

0.084

Annual Deviation

Population standard deviation of annual averages.

0.090

Average Annual Movement

Mean absolute year-over-year change.

0.292

Complete-Year Range

Difference between the 2018 low and 2023 peak.

LEVEL AND REPEATABILITY

The Modern Record Is Both High-Rated and Relatively Stable

Across the eleven completed years from 2015 through 2025, the annual average remains between 4.561 and 4.853 stars. The entire range spans only 0.292 stars, or approximately 7.3% of the usable four-star distance between the lowest and highest possible ratings.

The annual standard deviation is approximately 0.084 stars. This means most completed-year averages remain close to the modern-period mean of 4.717 rather than moving unpredictably across the scale.

This pattern supports a conclusion of long-term satisfaction stability within the observed review database. It does not independently establish installed-product reliability or represent every purchaser who did not submit a review.

High customer rating level combined with long-term stability
PERIOD COMPARISON

Stability Improved After 2020

The 2020–2025 completed-year period combines a higher average rating with lower annual variation than the 2015–2019 period.

Comparison of customer rating stability before and after 2020
Period Annual Mean Annual Deviation Average Annual Movement Rating Range Interpretation
2015–2019 4.666 0.083 0.119 0.253 Lower average and greater year-to-year movement.
2020–2025 4.759 0.057 0.067 0.162 Higher satisfaction with improved annual consistency.

From 2020–2025, the annual mean increased by approximately 0.093 stars while average year-to-year movement fell by approximately 44%. The later period therefore shows both stronger satisfaction and greater consistency.

Most stable three-year customer rating period
MOST STABLE WINDOW

2020–2022 Was the Most Stable Three-Year Period

Among modern completed years, the smallest three-year rating range occurs from 2020 through 2022. Annual averages were 4.733, 4.734, and 4.690, producing a total range of only 0.044 stars.

The population standard deviation across this three-year window is approximately 0.020 stars. This represents an unusually consistent period in which the average rating remained nearly unchanged despite annual review volumes ranging from 939 to 1,556.

The stability of this period provides a strong baseline for interpreting the sharp improvement recorded in 2023.

2020
4.733

1,110 dated ratings

2021
4.734

939 dated ratings

2022
4.690

1,556 dated ratings

SUSTAINED HIGH SATISFACTION

Seven Consecutive Complete Years Remained Above 4.6 Stars

From 2019 through 2025, every completed annual average exceeded 4.6 stars. This is the longest continuous high-satisfaction streak in the modern record using the report's transparent 4.6-star threshold.

Seven-year sustained high customer satisfaction streak
2019
4.643
2020
4.733
2021
4.734
2022
4.690
2023
4.853
2024
4.820
2025
4.725

The 4.6-star threshold is a report-specific descriptive benchmark, not an external industry standard.

PROPRIETARY TRANSPARENT METRIC

Rating Stability Index™

The report's Rating Stability Index™ summarizes annual deviation and full-period range on a 0–100 scale. It is an original descriptive metric and is not a universal statistical standard.

Rating Stability Index for long-term customer satisfaction
MODERN COMPLETE-YEAR SCORE
95.3
High Stability

Deviation Component

1 − (0.084 ÷ 4) = 97.9

Range Component

1 − (0.292 ÷ 4) = 92.7

The final score is the equal-weight average of the deviation and range components: (97.9 + 92.7) ÷ 2 = 95.3. The usable rating scale is four stars because ratings extend from 1 to 5.

2026 YTD INTERPRETATION

The 2026 Decline Does Not Yet Establish Structural Instability

The 2026 year-to-date average of 4.602 is 0.123 stars below 2025 and 0.251 stars below the 2023 peak. That is a material movement, but the period is incomplete and its composition differs from completed years.

Importantly, 99.1% of 2026 ratings remain four or five stars, and the three-star-and-below share is only 0.9%. The current change is therefore driven primarily by five-star-to-four-star migration rather than broad lower-rating growth.

A true stability break would require confirmation in the completed 2026 year and persistence into later periods. The present evidence supports a provisional shift in satisfaction intensity, not a confirmed collapse in customer satisfaction.

Interpretation of 2026 year-to-date rating stability
STABILITY CLASSIFICATION

Historical Stability by Period

Period Rating Level Stability Evidence Strength Interpretation
1995–2013 Generally high Not reliably measurable Exploratory Annual samples are too sparse for precise stability claims.
2015–2019 High Moderate Strong Transition period with greater annual movement.
2020–2025 Very high High Very strong volume Best combination of rating strength and repeatability.
2026 YTD High Provisional High volume, incomplete Potential intensity shift requiring full-year confirmation.
SECTION CONCLUSIONS

Eight Findings From the Stability Analysis

Modern Satisfaction Is High

The completed 2015–2025 annual mean is 4.717.

Annual Variation Is Limited

Annual standard deviation is approximately 0.084 stars.

Later Years Are More Stable

2020–2025 shows lower volatility than 2015–2019.

2020–2022 Was Most Stable

The three-year rating range was only 0.044 stars.

High Satisfaction Persisted

Seven consecutive completed years exceeded 4.6 stars.

Stability Score Is High

The transparent Rating Stability Index™ equals 95.3.

2026 Is Not Yet Structural

The incomplete-year decline requires later confirmation.

Intensity Changed More Than Positivity

2026 remains 99.1% four or five stars despite fewer five-star reviews.

Transition to short-term rating volatility analysis
SECTION 5.6.12 · PART 3.6

Short-Term Volatility Analysis

The next section will isolate the largest year-over-year movements, compare upward and downward shocks, and determine which changes exceeded the modern record's normal annual movement.

Section 5.6.12 Part 3.5 Methodology Note

Modern stability calculations use completed calendar years 2015–2025. The annual standard deviation is the population standard deviation of the eleven annual averages. Average annual movement is the mean absolute year-over-year change.

The Rating Stability Index™ is a proprietary descriptive metric: 50% deviation stability plus 50% range stability, each normalized against the usable four-star rating distance from 1 to 5. It is not an established statistical standard and should always be presented with its underlying values.

The 2026 period is year-to-date through June 26 and is excluded from completed-year stability calculations. All findings describe the observed review database and do not constitute verified field-failure rates or a probability sample of the full market.

SECTION 5.6.12 • PART 3.6

Final Historical Findings

The preceding sections examined annual averages, rating composition, historical turning points, customer satisfaction stability, and evidence strength across more than three decades of documented customer reviews. This section consolidates those analyses into the principal historical findings supported by the complete dataset.

EXECUTIVE FINDINGS

Ten Principal Findings

1. Long-Term Stability

Across the modern high-volume period, annual customer satisfaction remained remarkably stable. Typical year-to-year movement was small, indicating consistent long-term performance rather than recurring instability.

2. Positive Ratings Dominated

The overwhelming majority of documented reviews remained four or five stars throughout the historical record, demonstrating sustained positive customer sentiment despite normal annual variation.

3. Average Ratings Alone Are Incomplete

Annual averages provide only a partial description of customer experience. Rating composition, review volume, and historical continuity provide substantially greater explanatory value.

4. Five-Star Migration Explained Recent Movement

Recent reductions in annual averages were driven primarily by fewer five-star ratings rather than by substantial growth in lower-rated customer experiences.

5. Historical Turning Points Were Rare

Most annual fluctuations represented ordinary variation. Only a limited number of periods displayed characteristics consistent with genuine historical transitions.

6. Larger Samples Improved Confidence

Interpretive confidence increased substantially after annual review volumes reached hundreds and then thousands of observations, strengthening longitudinal comparisons.

7. Customer Expectations Continue to Evolve

Modern customers appear increasingly selective when assigning five-star ratings, suggesting changing expectations rather than widespread dissatisfaction.

8. Multi-Metric Analysis Improves Interpretation

Combining annual averages with rating distribution, review volume, stability measures, and confidence classifications produces a substantially richer understanding of customer behaviour.

9. High Ratings Do Not Eliminate Variability

Even highly rated products experience measurable year-to-year movement. Longitudinal analysis distinguishes expected variability from meaningful structural change.

10. Historical Context Matters

No single year should be interpreted independently. Reliable conclusions require evaluation within the complete historical timeline and documented evidence base.

Historical Trend Classification Matrix

Historical Finding Evidence Strength Observed Result Confidence
Long-Term Stability High Consistent annual averages High
Five-Star Migration High Supported by rating composition High
Lower-Rating Growth Low Limited evidence Moderate
Structural Decline Insufficient Not established Moderate
Historical Consistency Very High Supported across decades Very High
RESEARCH SUMMARY

The Historical Evidence Indicates Consistency Rather Than Instability

Taken together, the complete historical record supports a consistent conclusion. Customer satisfaction remained predominantly positive throughout the observation period, while changes in annual averages were more frequently associated with shifts in the balance between four-star and five-star reviews than with meaningful increases in negative customer experiences. The findings reinforce the importance of evaluating review composition, evidence strength, and long-term historical context instead of relying exclusively on average ratings.

NEXT SECTION

Industry Conclusions

The final section translates the statistical findings into practical guidance for manufacturers, architects, designers, distributors, procurement teams, and facility managers, while outlining the broader implications for interpreting customer-review data in the bathroom fixture industry.

SECTION 5.6.12 • PART 3.7

Industry Conclusions

Beyond documenting historical customer ratings, this study provides broader insight into how long-term customer satisfaction should be interpreted within the bathroom fixture industry. The findings suggest that evaluating customer experience requires considerably more than reporting average ratings. Review composition, evidence strength, historical continuity, and changing customer expectations together provide a more complete understanding of product performance over time.

INDUSTRY OBSERVATIONS

Ten Conclusions for the Bathroom Fixture Industry

1. Average Ratings Are Only the Beginning

An average rating summarizes customer feedback but does not explain why it changed. Organizations should evaluate rating distributions, review volume, and historical context before drawing conclusions.

2. Four-Star Reviews Matter More Than Many Assume

Four-star reviews often represent satisfied customers with specific opportunities for improvement. Their growth does not necessarily indicate declining product quality.

3. Customer Expectations Continue to Rise

Products that previously earned five-star ratings may now receive four stars as expectations evolve around installation, documentation, logistics, responsiveness, and post-purchase support.

4. Review Volume Improves Reliability

Long-term conclusions become substantially more reliable when supported by hundreds or thousands of independently submitted customer reviews.

5. Installation Influences Satisfaction

For bathroom fixtures, installation quality, plumbing compatibility, and commissioning frequently shape the overall customer experience alongside product design and manufacturing.

6. Documentation Is Part of the Product

Specification sheets, installation guides, BIM files, maintenance information, and technical support contribute directly to customer confidence and long-term satisfaction.

7. Longitudinal Studies Reveal More Than Annual Rankings

Historical trends help distinguish temporary fluctuations from sustained changes, allowing manufacturers and specifiers to make better-informed decisions.

8. Transparency Strengthens Trust

Clearly describing methodology, assumptions, and study limitations enables readers to evaluate findings with greater confidence and encourages independent verification.

9. Historical Context Improves Procurement Decisions

Architects, designers, contractors, facility managers, and procurement teams benefit from understanding long-term performance patterns rather than relying solely on recent ratings.

10. Independent Analysis Adds Value

Publishing reproducible research, transparent calculations, and documented historical evidence contributes to more informed discussions across the bathroom fixture industry.

Implications for Industry Stakeholders

Stakeholder Primary Takeaway Recommended Focus
Manufacturers Measure rating composition, not only averages. Product quality, documentation, service.
Architects & Designers Review long-term consistency. Specification confidence and lifecycle performance.
Contractors Installation quality affects perceived product performance. Correct installation and commissioning.
Facility Managers Operational reliability influences long-term satisfaction. Maintenance planning and lifecycle cost.
Procurement Teams Evaluate historical consistency alongside price. Whole-life value and documented performance.
OVERALL CONCLUSION

Reliable Decisions Depend on Complete Evidence

The principal lesson from this study is that customer satisfaction cannot be fully understood through a single metric. Average ratings, rating composition, review volume, historical continuity, and transparent methodology each contribute essential context. Together, these elements provide a more robust framework for evaluating long-term product performance and customer experience within the bathroom fixture industry.

FINAL SECTION

Study Conclusion & Research Appendix

The final section summarizes the complete study, outlines its methodology and limitations, references the research appendix, and provides guidance for citing and interpreting the findings in future work.

SECTION 5.6.12 · PART 3.8

Study Conclusion & Research Appendix

This study examined 14,367 dated customer ratings recorded between 1995 and 2026, including 11,381 review texts eligible for language analysis. The results demonstrate why long-term customer satisfaction should be evaluated through rating level, rating composition, historical stability, review volume, and transparent methodological controls rather than through average ratings alone.

Final conclusion of the thirty-year bathroom fixture customer review study
FINAL RESEARCH CONCLUSION

Long-term customer satisfaction remained strong, stable, and overwhelmingly positive.

Recent average-rating movement reflects reduced five-star concentration more than growth in dissatisfied customer experiences.

EXECUTIVE CONCLUSION

The Historical Record Supports Consistency, Not Structural Decline

Across the modern high-volume period, customer ratings remained within a relatively narrow range. The weighted 2015–2025 average was 4.721 stars across 12,134 dated ratings, while annual variation remained limited enough to produce a Rating Stability Index™ of 95.3 under the published study framework.

The strongest complete year was 2023, with an average of 4.853 across 1,675 ratings. The lowest complete modern year was 2018, with an average of 4.561 across 995 ratings. Even that lower point remained strongly positive.

The 2026 year-to-date average of 4.602 should not be interpreted as broad customer dissatisfaction. Four- and five-star ratings account for 99.1% of the partial-year record, while the lower average is driven principally by migration from five stars to four stars.

Executive conclusion of long-term bathroom fixture customer satisfaction
FINAL RESEARCH FINDINGS

Ten Principal Conclusions

1. Satisfaction Remained Strong

The long-term record remained overwhelmingly concentrated in positive four- and five-star outcomes.

2. Modern Ratings Were Stable

Annual movement was modest relative to the five-star scale, supporting a conclusion of long-term consistency.

3. Distribution Matters

Identical averages can describe very different customer-experience patterns and risk profiles.

4. Five-Star Migration Was Decisive

The 2023-to-2026 change was driven by fewer five-star ratings and more four-star ratings, not growth in severe dissatisfaction.

5. Low Ratings Stayed Rare

The combined one-, two-, and three-star share fell from 2.5% in 2023 to 0.9% in 2026 YTD.

6. Volume Increased Confidence

Modern years supported stronger descriptive analysis because annual samples reached hundreds and thousands of records.

7. Early Years Remain Exploratory

Sparse archival years provide continuity but should not be ranked with high-volume modern years.

8. Customer Expectations Evolved

A four-star rating increasingly appears to represent satisfaction accompanied by installation, delivery, documentation, or service friction.

9. Causality Was Not Assumed

Observed associations were not converted into unsupported claims about product defects, market behavior, or customer causation.

10. Transparency Increased Value

Published formulas, denominators, limitations, and appendix data make the study more useful and independently verifiable.

STUDY SCOPE

What Was Analyzed

Scope of the thirty-year bathroom fixture customer review study
Analytical Population Records Primary Use
Dated Numerical Ratings 14,367 Annual averages, star distributions, historical trends, and volatility
Eligible Review Texts 11,381 Topic frequency, customer language, complaint signals, and vocabulary analysis
Three Stars or Lower 419 Diagnostic analysis of lower-rated customer experiences
Historical Coverage 1995–2026 Longitudinal customer-satisfaction analysis across 32 calendar years
METHODOLOGY SUMMARY

How the Findings Were Produced

Record Validation

Records were screened for usable dates, numerical ratings, duplicate concerns, and text eligibility.

Annual Aggregation

Ratings were grouped by calendar year to calculate counts, means, star shares, and year-over-year movement.

Distribution Analysis

Five-, four-, three-, two-, and one-star shares were examined separately rather than relying only on averages.

Longitudinal Stability

Annual standard deviation, absolute movement, stable windows, and range were used to assess consistency.

Language Analysis

Eligible texts were classified using documented phrase families and topic rules.

Evidence Grading

Interpretive strength was adjusted for sample size, period completeness, and data quality.

STUDY LIMITATIONS

What the Evidence Does Not Establish

The database contains observational, self-selected customer reviews. It is not a probability sample of every bathroom-fixture buyer, every installed product, or the complete industry.

Review complaints should not be interpreted as verified engineering failure rates. Product conditions, shipping, installation, water pressure, documentation, customer expectations, and service experience may all influence the final rating.

The 2026 period is incomplete and should remain provisional until the full calendar year is available. Early historical years contain sparse samples and are retained for continuity rather than precise comparison.

Limitations of the bathroom fixture customer review study
PROPRIETARY METRIC DISCLOSURE

Original Metrics Are Identified Separately

Composite metrics developed for this study are analytical frameworks created for interpretation. They are not universal statistical standards.

Metric Purpose Disclosure Requirement
Rating Stability Index™ Summarizes long-term annual consistency Formula, scale, period, and limitations must be published
Customer Satisfaction Intensity Index™ Distinguishes strong endorsement from general satisfaction Weighting rules must remain visible
Review Distribution Quality Index Combines concentration, positive share, and lower-tail behavior Underlying star distribution must remain available
Evidence Confidence Grade Communicates interpretive strength Thresholds and period status must be stated
RESEARCH APPENDIX

Supporting Data & Calculations

The appendix contains the annual star distribution, percentage composition, weighted-average verification, proprietary metric calculations, volatility analysis, and exact 2023–2026 rating decomposition.

Research appendix supporting the bathroom fixture customer review study

Research Workbook

Includes annual counts, star percentages, weighted averages, stability measures, decomposition calculations, charts, and metric definitions.

View Workbook

HTML Appendix

Provides a browser-ready summary of the principal calculations, decomposition findings, methodology, and limitations.

View Appendix

Replace the document paths above if the files are uploaded to a different Volusion directory.

HOW TO CITE THIS STUDY

Recommended Citation

BathSelect Research. Thirty Years of Bathroom Fixture Customer Review Behavior: Rating Distribution, Satisfaction Stability, and Historical Trends, 1995–2026. Research Edition 1.0, published August 2026. Dataset: 14,367 dated ratings and 11,381 eligible review texts.

Publication

August 2026

Edition

Research Edition 1.0

Coverage

1995–2026

Methodology

Version 1.0

INDEPENDENT VERIFICATION

Peer Review & Reproducibility

The study's principal calculations were generated from the documented review database. Annual counts, star distributions, weighted averages, stability calculations, and decomposition results can be independently reproduced from the supporting workbook. Future editions should preserve the same core formulas and clearly disclose any methodology changes.

Reproducible Counts

Every annual result is tied to a documented record count.

Published Formulas

Composite metrics should retain visible formulas and weights.

Version Control

Future editions should record publication date, dataset cutoff, and methodology version.

Open Correction Policy

Material corrections should be documented rather than silently replaced.

Final call to review the bathroom fixture customer research appendix
COMPLETE RESEARCH PACKAGE

Review the Data Behind the Findings

Access the supporting appendix, inspect the annual calculations, and use the published methodology when citing or evaluating the study.

Publication & Update Note

Research Edition 1.0 · Published August 2026 · Historical coverage: 1995–2026 · Current-year records remain provisional until the calendar year is complete.

Future editions should disclose new record counts, dataset cutoff dates, methodology revisions, corrections, and any changes to proprietary metric formulas to preserve comparability.

FINAL RESEARCH DOCUMENTATION

Research Documentation, Verification & Citation Protocol

This section documents how the study was assembled, validated, interpreted, cited, updated, and prepared for independent review. It is designed to make the findings easier to verify, reproduce, compare, and reference in future research.

Research documentation and verification protocol for bathroom fixture customer review study
TRANSPARENCY PRINCIPLE

Every major figure should be traceable to a documented calculation.

Credibility depends on visible methods, explicit limitations, reproducible formulas, version control, and consistent citation.

1 · RESEARCH DOCUMENTATION

Dataset Origin, Coverage & Eligibility

The study uses a documented customer-review database containing dated numerical ratings and review text associated with bathroom fixtures, shower systems, faucets, and related products. The analysis covers 1995 through 2026.

The numerical rating analysis includes 14,367 records with valid dates and star ratings. The language analysis includes 11,381 review texts that passed the documented text-eligibility controls. Lower-rating analysis uses smaller subsets defined by the relevant star level, phrase family, topic, or period.

Records were evaluated for usable dates, valid rating values, duplicate concerns, missing fields, text sufficiency, and consistency with the selected analytical denominator.

Dataset origin and eligibility documentation
Documentation Item Study Treatment
Dataset Origin Documented customer-review database retained for historical analysis
Date Coverage 1995–2026, with 2026 treated as year-to-date
Numerical Rating Population 14,367 records with valid dates and numerical ratings
Text Population 11,381 review texts meeting text-eligibility requirements
Duplicate Handling Potential duplicates reviewed using identifying fields and repeated-content checks
Missing Data Records excluded only from analyses requiring the missing field
Analysis Date August 2026 research edition
2 · DATA VERIFICATION

Verification Process

Every major result was checked through multiple calculation and reconciliation steps.

Data verification process for customer review study

Annual Aggregation

Ratings were grouped independently by calendar year and reconciled against total counts.

Weighted-Average Check

Published means were verified against star counts and weighted-average calculations.

Star-Frequency Reconciliation

One- through five-star counts were checked to ensure they summed to the annual total.

Duplicate Review

Repeated identifiers, dates, ratings, and text patterns were reviewed for duplication risk.

Manual Spot Checks

Selected years and topic categories were manually reviewed against source records.

Year-over-Year Reconciliation

Annual movements were recalculated from adjacent-year averages rather than entered manually.

3 · STATISTICAL DEFINITIONS

Key Terms Used in the Study

Term Definition
Average RatingArithmetic mean of all eligible numerical ratings in the stated population.
Median RatingMiddle rating after eligible values are ordered.
Weighted AverageAverage that accounts for the number of records contributing to each value.
Sample SizeNumber of eligible records used in a calculation.
Standard DeviationMeasure of how widely values vary around their mean.
VolatilityMagnitude of movement across adjacent time periods.
Rating DistributionPercentage or count of ratings at each star level.
Five-Star MigrationShift from five-star ratings toward lower positive levels, especially four stars.
Positive Experience RatioShare of ratings classified as four or five stars.
Rating Stability Index™Proprietary metric summarizing long-term annual consistency.
Customer Satisfaction Intensity Index™Proprietary measure separating strong endorsement from general satisfaction.
Review Distribution Quality IndexComposite interpretation of concentration, positive share, lower-tail behavior, and evidence strength.
4 · RESEARCH LIMITATIONS

Limitations That Affect Interpretation

Observational Data

The study describes recorded reviews and does not use a controlled experimental design.

Self-Selection Bias

Customers who submit reviews may differ from customers who remain silent.

Review-Response Bias

Strongly positive or negative experiences may be more likely to produce reviews.

Product-Mix Change

Annual averages may change when the balance of product categories changes.

Expectation Drift

Customer standards may rise even when product quality remains stable.

Incomplete 2026

The current year is provisional and lacks complete seasonal coverage.

No Causal Inference

Observed associations do not prove why a rating changed.

Language Classification

Topic rules may miss context or create false matches in some reviews.

5 · RESEARCH FAQ

Frequently Asked Questions

Why are average ratings not enough?

Because identical averages can be produced by very different distributions, sample sizes, and historical patterns.

Why do four-star reviews matter?

They often represent satisfied customers who experienced specific friction, making them highly useful for improvement analysis.

Why not use Net Promoter Score?

The source database uses star ratings rather than the standard NPS recommendation question, so converting directly to NPS would be methodologically inappropriate.

Why are early years treated differently?

Small annual samples are highly sensitive to individual records and cannot support the same confidence as modern high-volume years.

Can this study predict future satisfaction?

No. Historical patterns can inform expectations but cannot guarantee future customer outcomes.

Can another researcher reproduce the findings?

Yes, provided the documented dataset, eligibility rules, formulas, and appendix calculations are available.

7 · VERSION HISTORY

Publication Record

Version Date Changes
1.0 August 2026 Initial publication using records available through the 2026 dataset cutoff
1.1 Planned update Correction, formatting, or documentation revisions without changing core methodology
2.0 2027 planned edition Complete 2026 year, expanded segmentation, and updated trend analysis
8 · REPRODUCIBILITY STATEMENT

Every Major Figure Can Be Reproduced

Every figure published in this report can be reproduced from the documented dataset using the eligibility rules, formulas, thresholds, and calculations described in the methodology and research appendix.

9 · FUTURE RESEARCH

Recommended Next Studies

Regional Differences

Customer behavior by geography and climate.

Commercial vs. Residential

Differences in priorities, complexity, and service expectations.

Finish Preferences

Trends in chrome, brushed gold, matte black, and other finishes.

Smart Fixture Adoption

Growth in digital, touchless, and connected products.

Installation Complexity

Relationship between system complexity and rating variability.

Hospitality Trends

Performance priorities in hotels, resorts, and branded residences.

Water Conservation

Customer response to efficiency and flow-performance features.

Facility Management

Maintenance, lifecycle, serviceability, and operational outcomes.

Permanent citation and research report identifier
10 · PERMANENT CITATION RECORD

Bathroom Fixture Customer Behavior Report™ 2026

REPORT NUMBER
BFR-2026-001
VERSION
1.0
PUBLISHED
August 2026
DATASET
14,367 Ratings

Recommended citation: BathSelect Research. Bathroom Fixture Customer Behavior Report™ 2026: Thirty Years of Rating Distribution, Satisfaction Stability, and Historical Trends. Report No. BFR-2026-001, Version 1.0, August 2026.

Technical Review Protocol

Annual aggregation, data validation, rating decomposition, confidence grading, handling of partial-year data, identification of trend changes, and classification of exploratory, moderate, strong, or very strong findings should follow the documented methodology consistently in every edition.

Any future change to eligibility rules, formulas, confidence thresholds, topic dictionaries, or proprietary metric weights should be recorded in the version history and disclosed before comparison with prior editions.

VERIFIED EXTERNAL REFERENCES

Independent Authority Sources

Use these links where the report discusses statistics, customer satisfaction, certification, plumbing performance, or water efficiency.

External references provide independent context only. Their inclusion does not represent certification, endorsement, sponsorship, or approval of any BathSelect product.

RELATED BATHSELECT RESOURCES

Continue Project Research

These internal links connect the research with related product categories, project resources, technical guidance, and post-purchase support.

Related BathSelect project and technical resources


CITATION & REUSE POLICY

Responsible Use of the Study

Use Permitted Approach Required Attribution
Short Quotations Brief excerpts for commentary Report title and BathSelect Research
Statistics Use exact published values Edition, year, and source page
Charts and Tables Reuse with visible attribution BathSelect Research and report link
Modified Graphics Label adaptations clearly “Adapted from BathSelect Research”
Commercial Republication Request written permission Approved publication credit
Updated Editions Cite the used version Version number and publication date
RECOMMENDED CITATION

Cite the Exact Edition Used

BathSelect Research. Bathroom Fixture Customer Behavior Report™ 2026: Thirty Years of Rating Distribution,